PS Exam Preparation
Comprehensive preparation for the NCEES Principles and Practice of Surveying (PS) exam. 5 modules covering all 5 exam domains with 50 in-depth topics.
Module 1: Legal Principles
Module 2: Professional Survey Practices
Module 3: Standards & Specifications
Module 4: Business Practices
Module 5: Areas of Practice
QA/QC Methods
Learning Objectives
After completing this topic, you should be able to:
- Distinguish between quality assurance (QA) and quality control (QC)
- Design field verification procedures for surveying operations
- Apply office check procedures to calculations and deliverables
- Explain the role of redundant measurements in quality management
- Apply statistical tests to evaluate measurement quality
- Develop and implement quality management plans for survey projects
Overview
Quality management in surveying has two complementary components: quality assurance (QA) prevents errors from entering the work, while quality control (QC) detects errors that have already occurred. Together, they form a systematic approach to ensuring that survey products meet the required accuracy, completeness, and reliability standards.
The cost of finding and correcting errors increases dramatically the later they are discovered. An error caught during a field check costs minutes; the same error caught after a map is filed may cost thousands of dollars and irreparable damage to professional reputation. The PS exam tests your ability to design and apply QA/QC procedures appropriate to the type and accuracy of the work being performed.
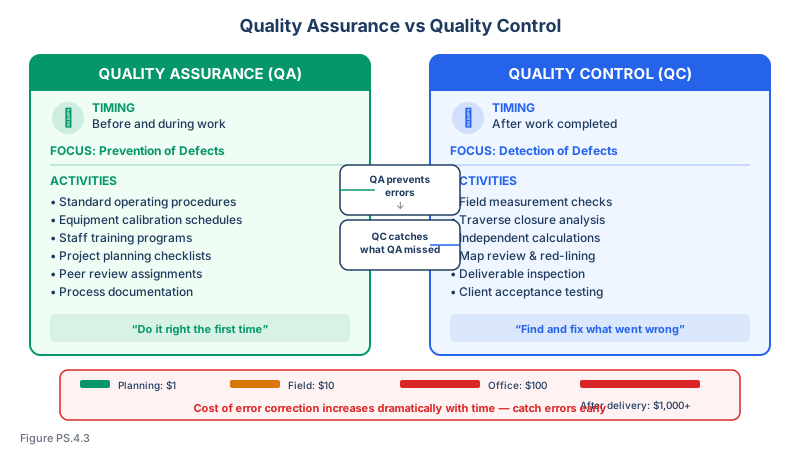
Quality Assurance vs. Quality Control
Definitions
| Concept | Definition | Timing | Focus |
|---|---|---|---|
| Quality Assurance (QA) | Systematic activities to ensure that quality requirements will be fulfilled | Before and during work | Prevention of defects |
| Quality Control (QC) | Activities to verify that deliverables meet specified requirements | After work is completed | Detection of defects |
QA Activities in Surveying
Quality assurance is proactive. It establishes the conditions for quality work:
| QA Activity | Purpose |
|---|---|
| Standard operating procedures (SOPs) | Ensure consistent methods across all crews and projects |
| Equipment calibration schedules | Maintain instrument accuracy |
| Training programs | Ensure personnel competency |
| Project planning | Define accuracy requirements and methods before work begins |
| Checklists | Prevent omission of required steps |
| Peer review assignments | Ensure independent review of all work |
| Document templates | Standardize deliverable format and content |
QC Activities in Surveying
Quality control is reactive. It verifies that the work meets requirements:
| QC Activity | Purpose |
|---|---|
| Field checks | Verify measurement accuracy in the field |
| Closure checks | Verify mathematical consistency |
| Independent computations | Verify calculations by a different person |
| Plat review | Verify completeness and accuracy of deliverables |
| Client review | Obtain feedback before finalizing |
| Statistical analysis | Verify that measurements meet accuracy standards |
Field Quality Control
Redundant Measurements
The most fundamental QC principle in surveying is redundancy. A single measurement provides no way to assess its quality. Redundant measurements allow both error detection and accuracy estimation.
| Measurement Type | Minimum Redundancy | Method |
|---|---|---|
| Angle | Direct and reverse (face left/face right) | Average eliminates instrument errors |
| Distance | Forward and back measurement | Difference reveals blunders |
| Level | Backsight and foresight from balanced setup | Loop closure detects errors |
| GNSS | Multiple sessions or repeat occupations | Coordinate comparison |
| Traverse | Close back to known point | Closure computation |
Field Check Procedures
Traverse Checks:
- Close the traverse back to the starting point or to another known point
- Compute angular closure (should not exceed the allowable value based on accuracy requirements)
- Compute linear closure and express as a ratio
- Compare closure to project accuracy requirements
Leveling Checks:
- Close level loops back to the starting benchmark
- Check section closures against allowable values
- Compare to published benchmark values when available
| Level Order | Allowable Closure |
|---|---|
| First Order, Class I | 3.0 mm x sqrt(K) |
| First Order, Class II | 4.0 mm x sqrt(K) |
| Second Order, Class I | 6.0 mm x sqrt(K) |
| Second Order, Class II | 8.0 mm x sqrt(K) |
| Third Order | 12.0 mm x sqrt(K) |
Where K = one-way leveling distance in kilometers. These are allowable loop misclosure tolerances per FGCS standards (not to be confused with the standard error per kilometer values used for station classification).
Common wrong path — using per-km standard error as if it were loop tolerance. Two different numbers look similar and are routinely confused: (1) standard error per km values used to classify a station (e.g., 0.7 mm/√K for First Order Class II), and (2) allowable loop misclosure tolerances used to accept or reject field work (e.g., 4.0 mm × √K for First Order Class II). The first is a statistical quality metric; the second is a field acceptance limit — and they differ roughly by a factor of four. Students sometimes apply the classification value as if it were the field tolerance and reject good work, or apply the loop tolerance as if it defined the class and accept work that doesn't meet standard. The correct rule: when the exam says "allowable misclosure for a closed loop," use the 3/4/6/8/12 mm×√K values above. When it asks about "standard error per km" or "station classification," use the 0.5/0.7/1.0/1.3/2.0 mm×√K values (roughly). Read the question for which one is being tested.
Quick retrieval check — try before reading on.
▶A crew runs a closed level loop of total length 8.4 km for a Second Order Class I project. The measured misclosure is 15.5 mm. Does the work meet standard?
Allowable misclosure = mm. The measured 15.5 mm is within the 17.39 mm tolerance, so yes, the work meets Second Order Class I. Distribute the 15.5 mm misclosure across the loop (typically by proportioning to the distances between benchmarks) and proceed with adjustment. Note: the same loop would not meet Second Order Class II if you accidentally applied 8.0 mm × √K (16.7 mm or better) — oh wait, that's also met. Let's try First Order Class II: mm — 15.5 mm fails. So the same data passes some orders and fails others; always check against the specific order the project requires.
GNSS Checks:
- Compare coordinate solutions from different sessions
- Check baseline residuals from network adjustment
- Verify results against known control points
- Monitor solution quality indicators (PDOP, number of satellites, fix quality)
Total Station Checks:
- Compare direct and reverse angle readings
- Verify prism constant settings
- Check to known distances and directions
- Verify backsight orientation at each setup
Blunder Detection
Blunders (gross errors) are the most dangerous type of error because they can be large enough to invalidate results but may not be obvious in the data:
| Common Blunder | Detection Method |
|---|---|
| Wrong prism height | Independent height verification, compare to ground elevation |
| Wrong point number | Field sketches, point descriptions, systematic numbering |
| Transposition error | Independent reading, digital recording |
| Wrong target | Verify target identification before measuring |
| Misidentified monument | Compare to record dimensions, independent verification |
Real-Time Field Verification
Modern data collectors and GNSS receivers provide real-time quality indicators:
| Indicator | What It Tells You |
|---|---|
| GNSS fix quality | Fixed integer ambiguity (best) vs. float vs. autonomous |
| PDOP | Geometry of satellite constellation (lower is better, typically below 3.0) |
| RMS | Root mean square of residuals from least squares solution |
| Number of satellites | More satellites generally improve solution quality |
| Baseline length | Longer baselines may reduce RTK accuracy |
| Age of corrections | Older corrections reduce RTK accuracy |
Office Quality Control
Calculation Checks
All calculations should be verified by a person other than the one who performed them:
| Calculation Type | Check Method |
|---|---|
| Traverse adjustment | Independent computation using same raw data |
| Coordinate geometry (COGO) | Reverse computation to verify results |
| Area calculations | Independent computation, DMD/DPD check |
| Curve calculations | Check using multiple formulas or independent computation |
| Elevation interpolation | Spot check against original data |
| Legal description | Plot the description and verify closure |
Map and Plat Review
Before delivery, every map or plat should be reviewed against a checklist:
Boundary Survey Plat Review Checklist:
| Item | Verification |
|---|---|
| Title block complete | Project name, surveyor name, license number, date |
| North arrow and scale | Correct orientation and representative fraction |
| Basis of bearings | Stated and consistent with evidence |
| Bearing and distance on all lines | Present and mathematically consistent |
| Monument descriptions | All found and set monuments described |
| Adjoining information | Adjacent owners or parcels identified |
| Easements | Recorded easements shown or noted |
| Area | Computed and shown, consistent with dimensions |
| Legend | All symbols defined |
| Certification | Proper language, signed, sealed |
| Mathematical closure | Bearings and distances close within tolerance |
| Record vs. measured comparison | Discrepancies noted and explained |
Document Review
Written deliverables (reports, legal descriptions, certifications) should be reviewed for:
- Technical accuracy of all statements
- Consistency with the survey plat
- Proper legal and professional language
- Completeness of required elements
- Freedom from ambiguity
- Correct client and property identification
Statistical Quality Methods
Standard Deviation and Standard Error
The standard deviation describes the dispersion of individual measurements:
Standard deviation (s) = sqrt( sum of (xi - mean)^2 / (n - 1) )
The standard error of the mean describes the uncertainty of the average:
Standard error = s / sqrt(n)
Increasing the number of measurements (n) improves the precision of the mean, but with diminishing returns.
Confidence Intervals
Confidence intervals express the range within which the true value is expected to lie:
| Confidence Level | Multiplier (k) |
|---|---|
| 68.3% (1 sigma) | 1.00 |
| 90% | 1.645 |
| 95% (2 sigma) | 1.960 |
| 99% | 2.576 |
| 99.7% (3 sigma) | 3.00 |
For a measurement with mean x-bar and standard error SE, the 95% confidence interval is: x-bar +/- 1.96 x SE.
Outlier Detection
Statistical tests can identify measurements that are likely blunders:
The 3-Sigma Rule: Any measurement deviating from the mean by more than 3 standard deviations is likely a blunder and should be investigated.
The Pope Test (Tau Test): A more rigorous test for outliers in least squares adjustments. The test statistic is compared to a critical value based on the number of redundant observations and the desired confidence level.
Chi-Square Test for Variance
The chi-square test evaluates whether the actual precision of measurements matches the expected (a priori) precision:
- If the test indicates the actual precision is significantly worse than expected, the observations may contain undetected blunders or the error model may be incorrect
- If the actual precision is significantly better than expected, the a priori error estimates may be too conservative
Positional Accuracy Standards
Several standards define positional accuracy requirements:
| Standard | Method | Common Application |
|---|---|---|
| NSSDA | RMSE at 95% confidence | Mapping and GIS |
| ASPRS | Based on RMSE | Photogrammetric mapping |
| FGDC | Based on NSSDA | Federal mapping programs |
| ALTA/NSPS | Relative positional precision | Land title surveys |
The ALTA/NSPS standards define Relative Positional Precision (RPP) as the uncertainty in the location of any boundary point relative to any other boundary point, at the 95% confidence level. The standard is a single formula: 2 cm + 50 ppm of the distance between any two boundary points. This applies to all boundary points regardless of the measurement method used (total station, GNSS, or otherwise).
Quality Management Plans
Elements of a Quality Management Plan
For larger projects or firms seeking consistent quality, a formal quality management plan includes:
| Element | Content |
|---|---|
| Quality policy | Management commitment to quality |
| Roles and responsibilities | Who performs and reviews each type of work |
| Procedures | SOPs for field, office, and delivery operations |
| Training requirements | Qualifications for each role |
| Equipment management | Calibration schedules, maintenance logs |
| Document control | Version management, filing standards |
| Corrective actions | Process for addressing quality failures |
| Records | What records to keep and for how long |
ISO 9001 and Surveying
Some surveying firms pursue ISO 9001 certification for their quality management systems. Key ISO 9001 principles applicable to surveying:
- Customer focus -- Understanding and meeting client requirements
- Process approach -- Managing activities as interconnected processes
- Continual improvement -- Systematically improving processes and outcomes
- Evidence-based decision making -- Using data to drive quality decisions
While ISO certification is not required for surveying firms, the underlying principles improve any firm's quality management.
Common Quality Failures
Root Cause Analysis
When quality failures occur, root cause analysis prevents recurrence:
| Failure | Apparent Cause | Root Cause | Corrective Action |
|---|---|---|---|
| Wrong boundary line on plat | CAD error | No independent plat review | Require peer review of all plats |
| Monument set in wrong location | Field crew misread coordinates | No field verification procedure | Require check measurement to second known point |
| Legal description does not close | Typo in bearing | No independent plot of description | Require all descriptions to be plotted by a different person |
| Client receives wrong file version | Multiple file versions in project folder | No version control system | Implement file naming convention and version control |
Cost of Quality
The cost of quality includes:
- Prevention costs -- Training, procedures, planning (invest here)
- Appraisal costs -- Inspections, reviews, testing (necessary but reactive)
- Internal failure costs -- Rework, scrap, re-survey (expensive but contained)
- External failure costs -- Liability claims, client losses, reputation damage (most expensive)
Investing in prevention is always cheaper than correcting failures after delivery.
Exam Tips
- Know the difference between QA (prevention) and QC (detection) -- the exam frequently tests this distinction
- Understand that redundant measurements are the foundation of quality in surveying
- Know the allowable closure standards for leveling by order and class
- Statistical concepts (standard deviation, confidence intervals, outlier detection) are testable
- Understand the concept of Relative Positional Precision as defined in the ALTA/NSPS standards
- Quality management questions may present a scenario and ask you to identify the appropriate check procedure
- Remember that finding errors before delivery is always preferable to finding them after
Related Test Topics
- Project Planning and Management (Topic 4.1)
- Survey Types and Scope of Services (Topic 4.3)
- Risk Management (Topic 4.6)
- Professional Conduct and Ethics (Topic 4.7)
Further Reading
Authoritative sources for deeper study
FGDC Geospatial Positioning Accuracy Standards — National standard for positional accuracy reporting (NSSDA).
Ghilani & Wolf, Adjustment Computations (5th Ed., 2010) — Authoritative treatment of least-squares adjustment for surveying networks.
Wolf & Ghilani, Elementary Surveying — An Introduction to Geomatics (13th+ Ed.) — Comprehensive surveying text covering instruments, field procedures, and computations.
Last updated: 2026-04-17