PS Exam Preparation
Comprehensive preparation for the NCEES Principles and Practice of Surveying (PS) exam. 5 modules covering all 5 exam domains with 50 in-depth topics.
Module 1: Legal Principles
Module 2: Professional Survey Practices
Module 3: Standards & Specifications
Module 4: Business Practices
Module 5: Areas of Practice
Hydrographic & Remote Sensing Surveys
Learning Objectives
After completing this topic, you should be able to:
- Describe the purpose and methods of hydrographic surveys
- Explain bathymetric measurement techniques and tidal datum references
- Identify common hydrographic survey equipment and accuracy standards
- Describe LiDAR technology, applications, and accuracy characteristics
- Explain aerial photogrammetry principles, control requirements, and products
- Understand remote sensing data types and their surveying applications
- Compare the advantages and limitations of different data collection platforms
Overview
Hydrographic surveys and remote sensing technologies extend the surveyor's reach beyond traditional ground-based measurement. Hydrographic surveys map the underwater terrain and features of water bodies, while remote sensing technologies (LiDAR, photogrammetry, satellite imagery) capture terrain and feature data from airborne or spaceborne platforms. These methods are essential for projects involving water boundaries, coastal engineering, floodplain mapping, large-area topographic mapping, and environmental assessment.
The PS exam tests your understanding of the principles, equipment, accuracy standards, and appropriate applications of these technologies.
Key Concepts
Hydrographic Surveys
Hydrographic surveys measure and map the physical features of water bodies:
Primary purposes:
- Navigation charting and harbor management
- Dredging design and monitoring
- Coastal and shoreline mapping
- Water boundary determination
- Flood studies and dam safety
- Bridge and pier foundation design
- Environmental and habitat mapping
Key elements measured:
- Bathymetry (water depths)
- Shoreline position
- Bottom composition and features
- Water levels and tidal characteristics
- Currents and flow velocities
- Underwater obstructions and structures
Bathymetric Measurement Methods
Single-beam echo sounder:
- Emits a single acoustic pulse downward
- Measures the two-way travel time of the reflected signal
- Depth = (Speed of Sound x Travel Time) / 2
- Speed of sound in water varies with temperature, salinity, and pressure (approximately 1,500 m/s in salt water)
- Produces depth profiles along survey lines
- Simple, reliable, and widely used
Multi-beam echo sounder:
- Emits a fan of acoustic beams across the track
- Measures depths at many points simultaneously across a swath
- Provides complete bottom coverage between survey lines
- More efficient for full-coverage bathymetric surveys
- Requires careful calibration (roll, pitch, heading, latency)
Side-scan sonar:
- Emits acoustic energy to both sides of the survey vessel
- Produces an acoustic image of the bottom surface
- Excellent for detecting objects, structures, and bottom texture
- Does not provide accurate depth measurements (complementary to echo sounders)
Acoustic Doppler Current Profiler (ADCP):
- Measures water current velocity and direction at multiple depths
- Can also estimate bottom depth
- Used for flow studies, discharge measurements, and navigation
Tidal Datums and Water Level Reference
Hydrographic surveys must reference water levels to a known datum:
| Datum | Definition | Common Use |
|---|---|---|
| Mean Higher High Water (MHHW) | Average of the higher high water over a 19-year epoch | Shoreline mapping, boundary determination |
| Mean High Water (MHW) | Average of all high water over a 19-year epoch | Tidal boundary line in many states |
| Mean Tide Level (MTL) | Average of MHW and MLW | General reference |
| Mean Sea Level (MSL) | Average of hourly water levels over a 19-year epoch | Vertical datum approximation |
| Mean Low Water (MLW) | Average of all low water over a 19-year epoch | Navigation reference (some charts) |
| Mean Lower Low Water (MLLW) | Average of the lower low water over a 19-year epoch | Chart datum (NOAA charts) |
The 19-year tidal epoch (National Tidal Datum Epoch) accounts for the 18.6-year lunar nodal cycle. The current epoch is 1983-2001.
Relationship to NAVD 88:
- Tidal datums are referenced to local tidal observations
- NAVD 88 is a fixed geodetic datum
- The relationship between tidal datums and NAVD 88 varies by location
- NOAA publishes tidal datum-to-NAVD 88 relationships at tide gauge stations
Common wrong path — using the wrong tidal datum for a boundary. Tidal waters have multiple plausible datums (MHW, MHHW, MLW, MLLW, etc.), and using the wrong one can move a legal water boundary by tens of feet. The general rule: boundary determination in tidal waters uses MHW or MHHW (depending on state law); chart datum for navigation is MLLW (different purpose). Students sometimes apply MLLW or MSL for a boundary question because those datums are more familiar from nautical charts — producing an answer that is hydrographically defensible but legally wrong. Check the state's specific statute for the tidal boundary definition before computing. Similarly, do not mix a tidal datum (MHW, MLLW) with a fixed geodetic datum (NAVD 88) without applying the local offset; the two differ by amounts that vary spatially, typically by tens of centimeters to a meter.
Quick retrieval check — try before reading on.
▶A nautical chart shows a shoreline at −3.2 ft (relative to MLLW). You need to determine the tidal boundary of a property fronting this shoreline. The state defines the tidal boundary as MHW. At this location, MHW is +4.8 ft above MLLW. What is the position of the boundary relative to the nautical-chart shoreline?
The nautical-chart shoreline at MLLW = 0 ft elevation in the MLLW frame. The MHW boundary is at +4.8 ft above MLLW. Under typical sloping coastal topography, the MHW line lies inland of the MLLW shoreline (higher elevation = farther from the water). The horizontal distance depends on the beach slope. If the beach has a 2% slope (1 ft rise per 50 ft horizontal), the MHW line would be approximately 4.8 / 0.02 = 240 ft inland of the MLLW shoreline. If the slope is 10% (steeper), it would be 4.8 / 0.10 = 48 ft inland. For a steeper slope still (1:1, 45°), approximately 5 ft inland.
The key practical point: the MLLW-based chart shoreline is not the legal tidal boundary — it is a navigation reference. The legal boundary (MHW per state statute) is measurably different in position, and that difference can be tens to hundreds of feet horizontally depending on slope. A surveyor who uses the chart shoreline as the boundary places the boundary in the wrong position.
Hydrographic Survey Equipment
Positioning systems:
- GNSS (RTK or DGPS) for vessel position
- Heading reference systems (gyrocompass, GNSS heading)
- Motion reference units (heave, roll, pitch compensation)
- Vessel-mounted inertial navigation systems
Depth measurement systems:
- Single-beam and multi-beam echo sounders
- Sound velocity profilers (SVP) for measuring speed of sound in the water column
- Bar check equipment for echo sounder calibration
Data acquisition:
- Hydrographic survey software integrating position and depth data
- Automatic tide gauge connections for real-time water level correction
- Data logging at high rates (multiple soundings per second)
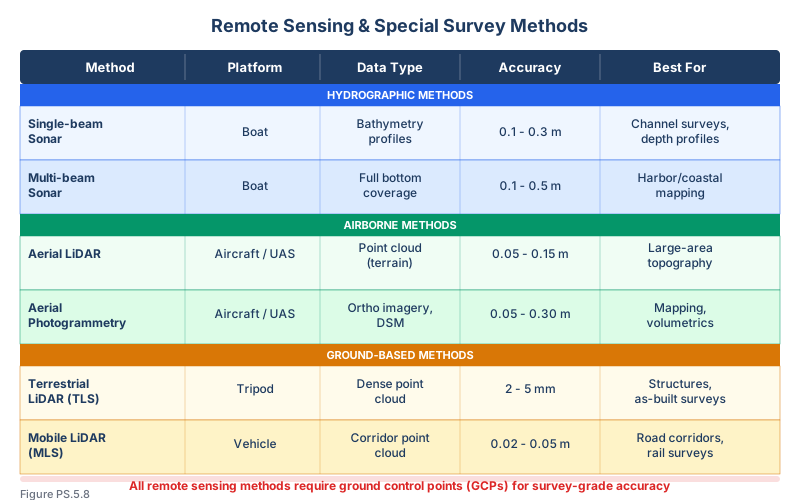
LiDAR (Light Detection and Ranging)
LiDAR is an active remote sensing technology that measures distances using laser pulses.
Airborne LiDAR operation:
- An aircraft-mounted laser emits rapid pulses toward the ground
- A scanning mechanism directs the laser across the flight path
- A receiver measures the time for each pulse to return
- GNSS and IMU (Inertial Measurement Unit) determine the sensor position and orientation
- Point coordinates are computed from the range, scan angle, and sensor position
LiDAR returns:
- First return -- Reflects from the top of the canopy or first surface encountered
- Last return -- Reflects from the ground surface (penetrates through vegetation)
- Intermediate returns -- Reflect from intermediate surfaces (understory, branches)
- Full waveform -- Records the entire return signal, enabling detailed analysis
Point classification:
- Raw LiDAR data contains millions of points that must be classified
- Common classes: ground, low vegetation, medium vegetation, high vegetation, buildings, water, noise
- Ground classification is essential for producing bare-earth terrain models
- Automated classification algorithms require manual quality checks
LiDAR accuracy:
| Component | Typical Accuracy |
|---|---|
| Horizontal | 10-30 cm (depending on altitude and system) |
| Vertical (open terrain) | 5-15 cm RMSE |
| Vertical (vegetated terrain) | 15-30 cm RMSE |
| Point density | 1-100+ points per square meter |
Bathymetric LiDAR:
- Uses green wavelength laser (532 nm) that penetrates water
- Simultaneously collects topographic (near-infrared) and bathymetric data
- Effective in clear, shallow water (typically less than 40 meters depth)
- Used for coastal mapping and nearshore surveys
Aerial Photogrammetry
Photogrammetry extracts three-dimensional measurements from overlapping photographs.
Principles:
- Stereo pairs of photographs taken from different positions enable 3D measurement
- The parallax difference between corresponding points in stereo pairs provides depth information
- Ground control points (GCPs) tie the photo model to the ground coordinate system
- Interior orientation (camera calibration), relative orientation (photo-to-photo), and absolute orientation (model-to-ground) establish the geometric relationship
Key parameters:
| Parameter | Definition | Typical Value |
|---|---|---|
| Forward overlap | Overlap between consecutive photos along the flight line | 60-80% |
| Side overlap | Overlap between adjacent flight lines | 25-40% |
| Flying height | Altitude above mean ground level | Varies by scale |
| Photo scale | Ratio of photo distance to ground distance | 1:3,000 to 1:40,000 |
| Ground Sample Distance (GSD) | Ground dimension of one pixel | 3-30 cm |
Ground control requirements:
- Minimum of 3-4 GCPs per photo model (more for larger blocks)
- GCPs must be visible in the photographs and precisely surveyed on the ground
- Aerial triangulation (AT) extends control across large photo blocks using tie points
- GNSS-aided aerial triangulation reduces (but does not eliminate) the need for ground control
Photogrammetric products:
- Orthophotography (rectified, georeferenced aerial imagery)
- Topographic contour maps
- Digital terrain models
- Planimetric feature mapping
- 3D building models
Accuracy depends on:
- Flying height and camera focal length
- Quality of ground control
- Terrain relief relative to flying height
- Operator skill (for manual compilation)
- Software algorithms (for automated extraction)
UAS (Drone) Photogrammetry and LiDAR
Unmanned Aircraft Systems (UAS) have expanded access to photogrammetry and LiDAR:
- Lower cost and faster deployment than manned aircraft
- Higher resolution data collection (lower flying heights)
- Suitable for small to medium-sized project sites
- Require ground control or PPK/RTK GNSS for accuracy
- FAA Part 107 regulations govern commercial UAS operations
- Rapidly evolving technology with increasing capabilities
Satellite Remote Sensing
Satellite platforms provide data for large-area mapping:
- Optical imagery -- Multi-spectral data for land use, vegetation, and planimetric mapping
- Radar (SAR) -- Synthetic Aperture Radar for terrain and change detection, works through clouds
- Satellite-derived elevation data -- SRTM, ASTER GDEM, and commercial stereo satellite imagery
- Resolution and accuracy are generally lower than airborne methods but cover larger areas
- Useful for reconnaissance, planning, and monitoring at regional to global scales
Exam Tips
- Speed of sound in water is approximately 1,500 m/s -- echo sounder depth = (speed x time) / 2
- The 19-year tidal epoch accounts for the 18.6-year lunar nodal cycle
- MLLW is the chart datum used on NOAA nautical charts; MHW or MHHW is typically used for tidal boundary determination
- LiDAR last returns penetrate vegetation to reach the ground; first returns map the canopy surface
- Photogrammetric accuracy depends on flying height, camera focal length, and ground control quality
- Ground control points are required for both photogrammetry and LiDAR (GNSS/IMU provide some, but GCPs are needed for verification)
- Multi-beam sonar provides full bottom coverage; single-beam provides profiles along survey lines
- Side-scan sonar produces images of the bottom but does not provide accurate depth measurements
- Bathymetric LiDAR uses green wavelength (532 nm) to penetrate water; standard topographic LiDAR uses near-infrared which does not penetrate water
- Forward overlap in aerial photography is typically 60-80%; side overlap is 25-40%
Related Test Topics
- Topographic and planimetric mapping (Topic 5.7)
- Datums and reference frames -- tidal datums (Topic 5.3)
- Map accuracy standards (Topic 5.13)
- Geospatial accuracy standards (Topic 5.14)
- Control networks for mapping projects (Topic 5.2)
- Riparian, littoral, and water boundary law (Module 1, Topic 1.7)
Further Reading
Authoritative sources for deeper study
Shalowitz & Reed, Shore and Sea Boundaries (Vols. 1–3, NOAA) — Definitive U.S. reference on water-boundary law and tidal datums.
FEMA Elevation Certificate (Form FF-206) — Official form and instructions for NFIP elevation certifications.
FGDC Geospatial Positioning Accuracy Standards — National standard for positional accuracy reporting (NSSDA).
Last updated: 2026-04-17