FS Exam Preparation
Comprehensive preparation for the Fundamentals of Surveying (FS) exam. 7 modules covering all 7 exam domains with 60 in-depth topics.
Module 1: Surveying Processes & Methods
Module 2: Mapping Processes & Methods
Module 3: Boundary Law & Real Property
Module 4: Surveying Principles & Geodesy
Module 5: Survey Computations
Module 6: Business Concepts
Plan & Profile Drawings
Learning Objectives
After completing this topic, you should be able to:
- Distinguish between plan, profile, and cross-section views
- Read and interpret a plan and profile sheet
- Understand vertical exaggeration and its purpose
- Interpret grading plans and earthwork drawings
- Calculate grades and slopes from profile data
- Identify common conventions for plan and profile drawings
Overview
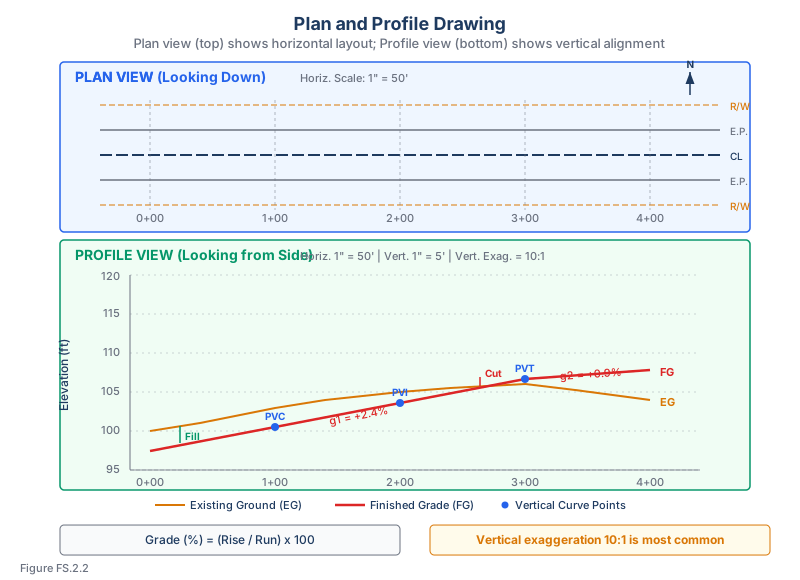
Plan and profile drawings are the primary means of communicating engineering designs for linear projects such as roads, pipelines, channels, and utilities. The plan view shows the horizontal layout (bird's eye view), while the profile view shows the vertical alignment (side view along the centerline). Together, they provide the complete geometric definition of the project.
These drawings are fundamental to civil engineering and construction surveying. The FS exam tests your ability to read, interpret, and perform basic calculations from plan and profile sheets.
Key Concepts
Plan View
The plan view is a view looking straight down at the project from above. It shows:
- Horizontal alignment: The route of the road, pipe, or channel in plan
- Right-of-way and easement limits
- Topographic features: Contour lines, buildings, trees, utilities
- Stationing: Distance measured along the centerline, marked at regular intervals (e.g., every 100 ft or 20 m)
- Curve data: Horizontal curve geometry (PC, PT, PI, radius, delta angle)
- Lot lines and property boundaries
- Utility locations and crossings
Conventions:
- North arrow is typically at the top or upper right
- Stationing increases from left to right
- The plan is drawn at the project's horizontal scale (e.g., 1 inch = 50 feet)
Stationing Notation
Stationing establishes a one-dimensional linear reference system along the project centerline. Every 100 ft of centerline length is one station. Station numbers are written with a plus sign that separates whole stations from the fractional part in feet:
0+00-- station zero (project start)1+00-- 100 ft from start10+32.5-- 1,032.5 ft from start7+25.45-- 725.45 ft from start
Why start at 0+00 is rare in practice. Most projects begin at 10+00 or 100+00 so that later extensions of the alignment (or a revised tie-in) do not require negative stations. If the project is later extended upstream and the surveyor added 80 ft of alignment, the new begin point becomes 9+20 -- cleaner than -0+80.
Offset notation locates features adjacent to the centerline using two numbers -- a station and a right/left offset measured at 90° to the centerline:
26+78, 30' Rt-- a feature 30 ft to the right of centerline, at station 26+7812+50, 10' Lt-- a feature 10 ft to the left of centerline, at station 12+50
Right and left are defined by the direction of increasing stations. The surveyor (or reader) must face up-station to determine which side is "right" or "left" -- otherwise the offset flips. Highway convention is that stationing increases west-to-east and south-to-north on most projects, though the plan's north arrow always governs. Source: Basic Surveying Manual (Wisconsin LTAP, 2002), "Stationing"; see also Kavanagh, Surveying with Construction Applications (7th Ed.), Ch. 11, and Ghilani & Wolf, Elementary Surveying (13th Ed.), Ch. 23.
Profile View
The profile view shows the ground surface and design grade along the project centerline, viewed from the side.
What it shows:
- Existing ground profile: The natural ground elevation along the centerline
- Design grade (proposed profile): The finished grade elevations
- Vertical curves: Parabolic curves connecting tangent grades
- Stationing: Matches the plan view above
- Elevations: Read from the vertical axis
- Cut and fill: The difference between existing ground and design grade at each station
Conventions:
- The profile is drawn directly below the plan view on the same sheet
- Stationing on the horizontal axis matches the plan view above
- Elevations are shown on the vertical axis
Vertical Exaggeration
Profile views are drawn with vertical exaggeration -- the vertical scale is larger than the horizontal scale -- to make grade changes visible.
Common exaggeration ratios:
- 10:1 -- the most common (e.g., horizontal 1 inch = 50 ft, vertical 1 inch = 5 ft)
- 5:1 -- used for steeper terrain
- 2:1 -- used for very steep terrain
Purpose: Without exaggeration, a 2% grade change would appear as an almost invisible line on the profile. Vertical exaggeration makes slopes, curves, and elevation changes clearly readable.
Caution: Vertical exaggeration distorts the visual appearance of slopes. A gentle 2% grade appears steep when exaggerated 10:1.
Common wrong path — reading slopes off an exaggerated profile as if they were true. Profile views use vertical exaggeration (typically 10:1) to make grades readable, but this distorts the visual appearance of slopes. A 2% grade drawn at 10× vertical exaggeration looks like a 20% grade on the paper, which can lead to misinterpretation if you try to estimate slopes visually. The scale ratio must be used: (slope as it appears on paper) ÷ (vertical exaggeration ratio) = (true slope). A profile drawn at 1″=50 ft horizontal and 1″=5 ft vertical has 10:1 exaggeration; a line rising 1 inch over 5 inches (looks like 20%) is actually a 2% grade. Students reading profile drawings sometimes report the apparent slope rather than the true slope. Always check the horizontal and vertical scales before interpreting a grade from profile geometry — or just read the grade label directly if provided.
Quick retrieval check — try before reading on.
▶A profile is drawn at 1" = 40 ft horizontal and 1" = 4 ft vertical. A design grade line rises 1.5 inches over 5 inches on the profile. What is the true grade?
True rise = 1.5 inches × (4 ft per inch) = 6 ft.
True run = 5 inches × (40 ft per inch) = 200 ft.
Grade = rise/run × 100 = 6/200 × 100 = 3%.
If you had read the slope as it appears on paper (1.5"/5" = 30% visually), you'd report a 30% grade — 10× too steep. The 10:1 vertical exaggeration (40 ft horizontal vs 4 ft vertical per inch) multiplies apparent slope by 10 compared to the true slope. Always decode the exaggeration by separating horizontal and vertical scales and computing the true rise and run from the drawn lengths.
Cross-Sections
Cross-sections show the terrain and design perpendicular to the centerline at specific stations.
What they show:
- Existing ground surface across the project width
- Proposed improvements (pavement, shoulders, ditches, slopes)
- Cut and fill areas at each station
- Slope stake catch points
Uses:
- Computing earthwork volumes (by the average end area method or prismoidal method)
- Defining the limits of grading
- Determining quantities of cut and fill material
Grade and Slope Calculations
Grade (percent):
Example: A road rises 8 ft over a horizontal distance of 400 ft:
- Grade = (8 / 400) x 100 = 2.0%
Slope ratio:
- Expressed as horizontal:vertical (e.g., 3:1 means 3 ft horizontal for every 1 ft vertical)
- A 3:1 slope = 33.3% grade
- A 2:1 slope = 50% grade
Conversions:
| Percent Grade | Slope Ratio | Description |
|---|---|---|
| 1% | 100:1 | Very flat |
| 2% | 50:1 | Typical road grade |
| 5% | 20:1 | Moderate grade |
| 10% | 10:1 | Steep road grade |
| 33.3% | 3:1 | Typical fill slope |
| 50% | 2:1 | Typical cut slope |
Vertical Curves
Vertical curves are parabolic curves used to transition between two tangent grades. They provide a smooth ride, adequate sight distance, and proper drainage.
Types:
- Crest curve: Connects an ascending grade to a descending grade (or a steeper ascending to a less steep ascending)
- Sag curve: Connects a descending grade to an ascending grade (or a steeper descending to a less steep descending)
Key parameters:
- PVC: Point of Vertical Curvature (beginning of curve)
- PVI: Point of Vertical Intersection (where the two tangent grades would meet)
- PVT: Point of Vertical Tangency (end of curve)
- L: Length of the vertical curve
- g1, g2: The incoming and outgoing grades (in percent)
Elevation on a vertical curve:
Where x is the distance from the PVC and grades are expressed as decimals.
Exam Tips
- The profile view is drawn directly below the plan view with matching stationing
- Vertical exaggeration makes gentle slopes visible; the most common ratio is 10:1
- Grade (%) = (rise / run) x 100 -- this is a fundamental calculation
- A 3:1 slope ratio means 3 horizontal to 1 vertical = 33.3% grade
- Vertical curves are parabolic, not circular
- Know the difference between crest (top of hill) and sag (bottom of valley) vertical curves
- Cross-sections are perpendicular to the centerline; they are used for earthwork volume calculations
- The FS exam may give you profile data and ask you to compute grades, elevations, or cut/fill quantities
- Stationing increases from left to right on both plan and profile views
Related Test Topics
- Construction Surveys and Staking (Module 1, Topic 1.8)
- Route Surveying and Alignments (Module 4, Topic 4.3)
- Digital Terrain Models (Topic 2.6)
- Topographic Surveys (Module 1, Topic 1.7)
Further Reading
Authoritative sources for deeper study
Kavanagh, Surveying with Construction Applications (7th Ed.) — Combined surveying and construction-layout reference.
Wolf & Ghilani, Elementary Surveying — An Introduction to Geomatics (13th Ed., 2012) — Comprehensive surveying text covering instruments, field procedures, and computations.
MUTCD 2023 Part 6 — Temporary Traffic Control — Federal standard for work-zone traffic control devices and surveyor safety.
Last updated: 2026-04-17