FS Exam Preparation
Comprehensive preparation for the Fundamentals of Surveying (FS) exam. 7 modules covering all 7 exam domains with 60 in-depth topics.
Module 1: Surveying Processes & Methods
Module 2: Mapping Processes & Methods
Module 3: Boundary Law & Real Property
Module 4: Surveying Principles & Geodesy
Module 5: Survey Computations
Module 6: Business Concepts
Data Analysis & Quality Control
Learning Objectives
After completing this topic, you should be able to:
- Apply outlier detection methods to identify blunders
- Describe quality assurance vs. quality control
- Explain the purpose and methods of independent checks
- Interpret residuals from a least squares adjustment
- Apply rejection criteria for suspect measurements
- Describe field verification procedures
Overview
Data analysis and quality control ensure that survey measurements and computations are free from blunders and meet specified accuracy requirements. Quality control is not an afterthought -- it is an integral part of every survey from planning through delivery. The FS exam tests your ability to identify bad data, apply rejection criteria, and understand the systematic approach to ensuring survey quality.
Key Concepts
Quality Assurance vs. Quality Control
| Concept | Definition | Focus | Examples |
|---|---|---|---|
| Quality Assurance (QA) | Planned processes to prevent errors | Proactive (before and during work) | Calibration schedules, SOPs, training, checklists |
| Quality Control (QC) | Activities to verify that quality requirements are met | Reactive (checking completed work) | Independent checks, closure analysis, residual analysis |
QA builds quality into the process. QC verifies that quality was achieved.
Blunder Detection
Blunders (gross errors) are the most dangerous type of error because they can produce results that appear plausible but are completely wrong. Detection methods include:
Redundant measurements:
- Measure more than the minimum required
- Compare independent measurements of the same quantity
- Inconsistencies reveal potential blunders
Closure checks:
- Angular closure of a traverse
- Linear closure of a traverse
- Level loop closure
- Three-wire leveling (sum of upper and lower should equal twice the middle)
Statistical tests:
- Compare each measurement against the expected value
- Flag measurements that exceed a threshold (e.g., 3 sigma)
Outlier Detection Methods
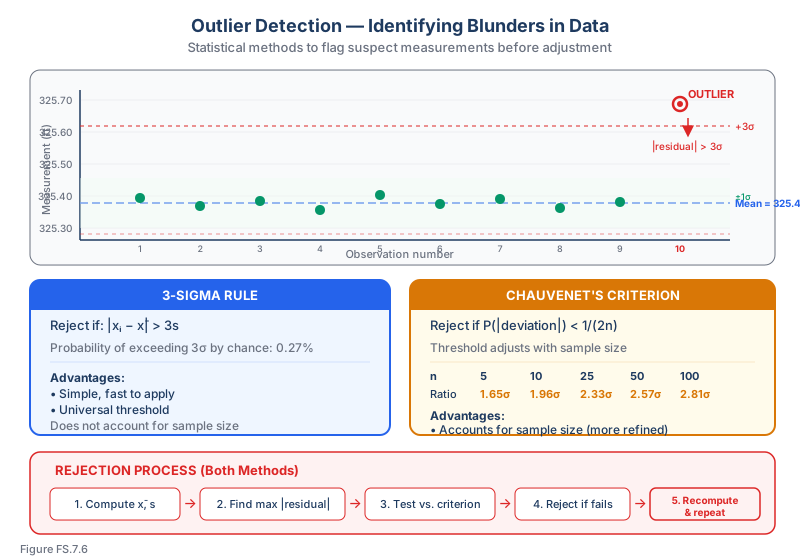
The 3-sigma rule (Ghilani & Wolf, Elementary Surveying, 13th Ed., §3.16; Ghilani, Adjustment Computations, 5th Ed., §3.21):
If a measurement deviates from the mean by more than 3 standard deviations, it is suspected to be a blunder. Under the normal distribution, the probability of a measurement exceeding 3 sigma purely by chance is only 0.27%.
Rejection criterion: |xi - x_bar| > 3 * s
Chauvenet's criterion (Ghilani & Wolf, Adjustment Computations: Spatial Data Analysis, 5th Ed., Table 3.2):
A measurement is rejected if the probability of obtaining a deviation as large or larger is less than 1/(2n), where n is the number of measurements.
| n | Rejection ratio |
|---|---|
| 3 | 1.38 sigma |
| 5 | 1.65 sigma |
| 10 | 1.96 sigma |
| 25 | 2.33 sigma |
| 50 | 2.57 sigma |
| 100 | 2.81 sigma |
Process:
- Compute mean and standard deviation
- Find the measurement with the largest residual
- If the residual exceeds the Chauvenet criterion, reject that measurement
- Recompute mean and standard deviation without the rejected measurement
- Repeat until no more measurements are rejected
Important: Only reject one measurement at a time, then recompute.
Dixon's Q-test (Dixon, "Ratios Involving Extreme Values," Analytical Chemistry 23(4):636–638, 1951):
For small samples, compare the gap between the suspect value and its nearest neighbor to the total range:
Q = |suspect - nearest| / (max - min)
Compare Q to critical values. If Q exceeds the critical value, reject the suspect measurement.
Common wrong path — rejecting multiple outliers in one pass. The Chauvenet (and similar) criterion is designed to identify one most-suspect outlier at a time. Applying the rejection criterion to all outliers simultaneously — removing every observation that exceeds the threshold in the original data — overcorrects the data set and distorts the statistics. The correct procedure is iterative: (1) compute mean and σ from all observations; (2) identify the observation with the largest absolute residual; (3) if it exceeds the criterion, reject it; (4) recompute mean and σ on the remaining observations; (5) repeat from step 2 until no observation exceeds the criterion. This iteration matters because removing one outlier changes the mean and σ, which can pull other observations back inside the criterion. Students who multi-reject in one pass often strip too many observations, producing an overly clean but unrepresentative data set.
Quick retrieval check — try before reading on.
▶You have 10 measurements and apply the 3-sigma rule to find outliers. Three measurements exceed 3 sigma from the mean. Should you reject all three at once, or apply the criterion iteratively?
Iteratively. Reject only the measurement with the largest absolute deviation first. Recompute the mean and standard deviation from the remaining 9 measurements. Then check the new set of 9 against the recomputed 3-sigma threshold — it is entirely possible that one or two of the other "outliers" fall within 3 sigma of the new mean (because removing the first outlier tightened the distribution). Continue iterating until no measurement exceeds the criterion on the current statistics.
If you had rejected all three simultaneously from the original statistics, you might have rejected one or two measurements that are actually valid (but appeared as outliers only because a single gross blunder was inflating the standard deviation). This is especially problematic when n is small — rejecting three out of ten measurements leaves only seven, which changes the statistical confidence in the remaining data set significantly. One-at-a-time iterative rejection is the standard professional practice and is what exam questions expect.
Independent Checks
An independent check uses a different method, different data, or a different person to verify the same result:
| Check Type | Example |
|---|---|
| Computational check | Computing area by both coordinate method and DMD method |
| Measurement check | Measuring a distance with both tape and EDM |
| Observation check | Closing a level loop back to the starting benchmark |
| Review check | Having a second person review computations and field notes |
| Redundant observation | Measuring an angle by both direct and reverse (face left/face right) |
Residual Analysis
After adjustment, residuals indicate how well the model fits the observations:
- Small, randomly distributed residuals: Good adjustment, no systematic problems
- Large residuals: May indicate blunders in specific measurements
- Patterned residuals: Suggest unmodeled systematic errors
- All residuals the same sign: Possible systematic error
Post-adjustment checks:
- Reference variance should be close to 1.0 (if weights are properly assigned)
- Chi-squared test on the reference variance to check goodness of fit
- Inspect the largest residuals for potential blunders
- Check that residuals are approximately normally distributed
Field Verification Procedures
Systematic field QC includes:
- Instrument checks: Two-peg test for levels, collimation check for total stations
- Double-run leveling: Level forward and backward; compare for consistency
- Direct and reverse angles: Average face-left and face-right readings to eliminate systematic instrument errors
- Repeated measurements: Multiple sets of angles or distance measurements for statistical analysis
- Closure observations: Return to known points to check for consistency
- Real-time checks: Compare measurements to expected values in the field; investigate discrepancies immediately rather than waiting for office processing
Data Processing Quality Checks
- Input verification: Check that data was entered correctly (compare to field notes)
- Reasonableness check: Are values within expected ranges?
- Consistency check: Do related quantities agree (e.g., sum of angles, coordinate differences)?
- Independent recomputation: Have a second person independently compute key results
- Comparison to prior surveys: Do results agree with previous surveys within expected tolerances?
Exam Tips
- QA is proactive (preventing errors); QC is reactive (detecting errors) -- know the difference
- The 3-sigma rule is the simplest rejection criterion: if |residual| > 3s, suspect a blunder
- Chauvenet's criterion is more refined than 3-sigma and accounts for sample size
- Always reject only one outlier at a time, then recompute statistics before testing the next suspect value
- Blunders cannot be adjusted away -- they must be detected and removed before adjustment
- If a level loop does not close, the first question is whether there is a blunder, not how to adjust the closure
- Independent checks are the gold standard for quality verification -- the same person checking their own work is NOT independent
- On the FS exam, quality control questions often ask you to identify the appropriate check for a given situation
- The reference variance (or variance factor) from a least squares adjustment should be close to 1.0 -- significantly greater than 1.0 suggests measurement errors are larger than assumed
Related Test Topics
- Probability and Statistics (Topic 7.3)
- Error Analysis and Propagation (Topic 7.4)
- Measurement Accuracy and Precision (Topic 7.5)
- Least Squares Adjustments (Topic 5.5)
Further Reading
Authoritative sources for deeper study
Ghilani & Wolf, Adjustment Computations (5th Ed., 2010), Ch. 3 — Statistical foundations: mean, variance, distributions, confidence.
FGDC Geospatial Positioning Accuracy Standards — National standard for positional accuracy reporting (NSSDA).
Wolf & Ghilani, Elementary Surveying — Chapter on theory of errors and error propagation.
Last updated: 2026-04-17