FS Exam Preparation
Comprehensive preparation for the Fundamentals of Surveying (FS) exam. 7 modules covering all 7 exam domains with 60 in-depth topics.
Module 1: Surveying Processes & Methods
Module 2: Mapping Processes & Methods
Module 3: Boundary Law & Real Property
Module 4: Surveying Principles & Geodesy
Module 5: Survey Computations
Module 6: Business Concepts
GIS Fundamentals & Spatial Analysis
Learning Objectives
After completing this topic, you should be able to:
- Define GIS and its components
- Distinguish between vector and raster data models
- Explain spatial analysis operations (buffer, overlay, query)
- Understand attribute data and its relationship to spatial features
- Describe coordinate system and projection requirements in GIS
- Identify how surveying data feeds into GIS systems
Overview
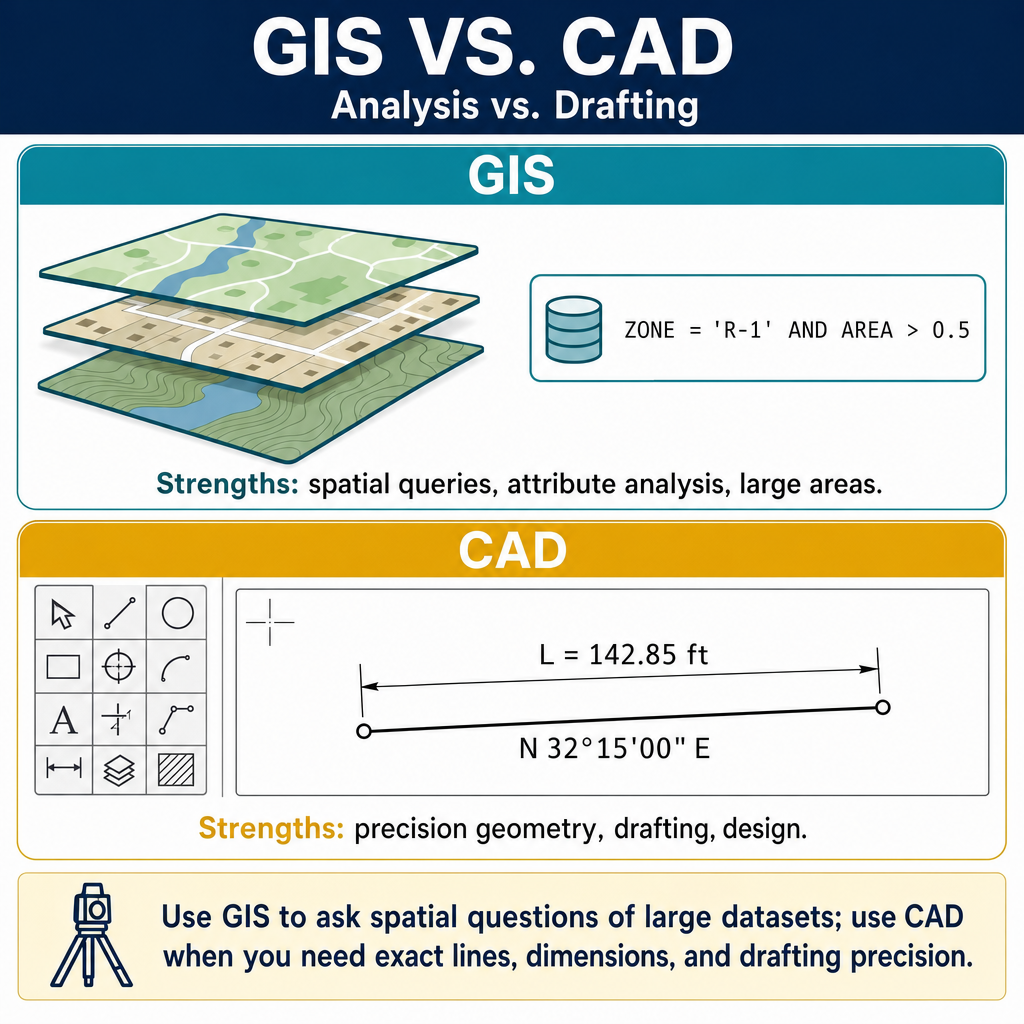
A Geographic Information System (GIS) is a system for capturing, storing, managing, analyzing, and displaying geographically referenced data. While CAD focuses on drafting and design, GIS emphasizes spatial relationships, analysis, and data management. Surveyors contribute critical spatial data to GIS databases and must understand how their data integrates with the broader geospatial ecosystem.
The FS exam tests fundamental GIS concepts including data models, spatial analysis operations, and the relationship between surveying and GIS.
Key Concepts
Components of a GIS
A complete GIS includes:
- Hardware: Computers, servers, GPS receivers, digitizers, plotters
- Software: GIS applications (ArcGIS, QGIS, etc.)
- Data: Spatial data (locations) and attribute data (characteristics)
- People: Users, analysts, database administrators
- Methods: Procedures for data collection, analysis, and quality control
Data Models: Vector vs. Raster
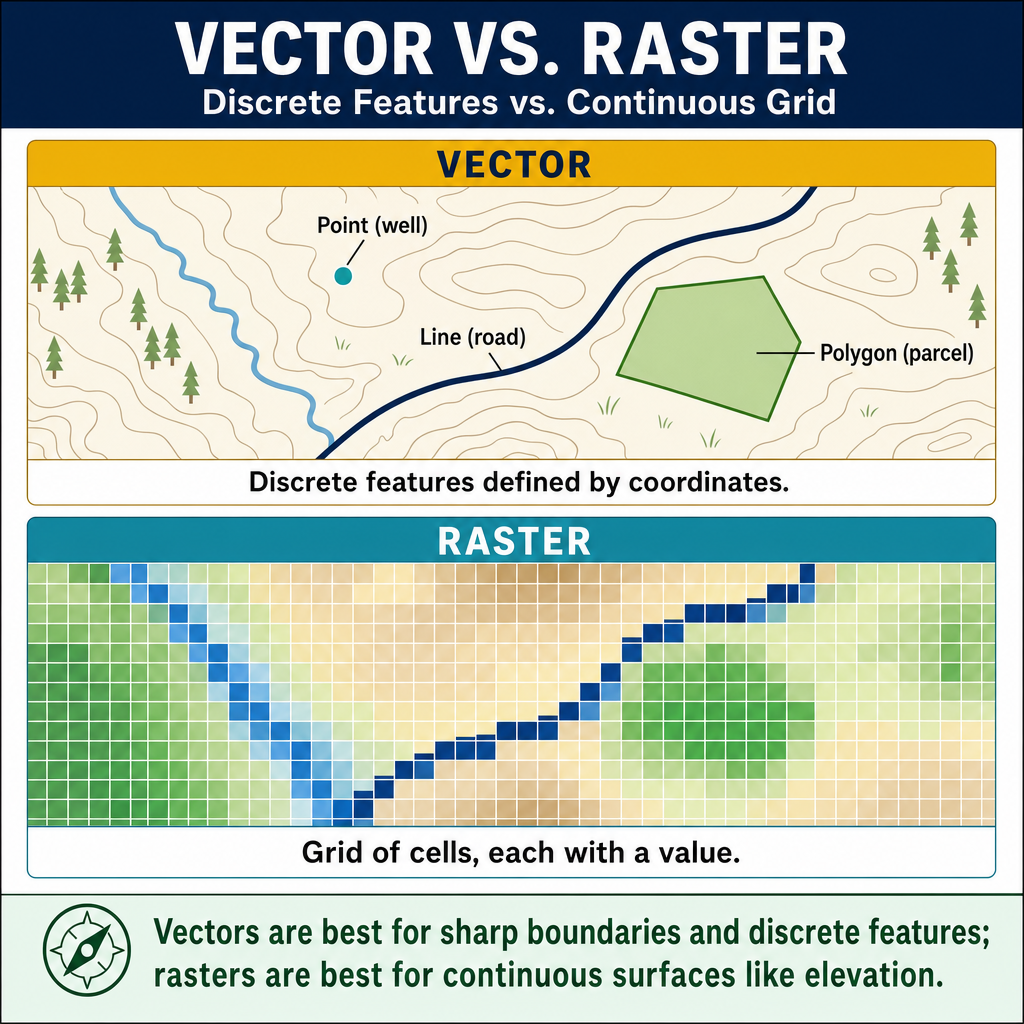
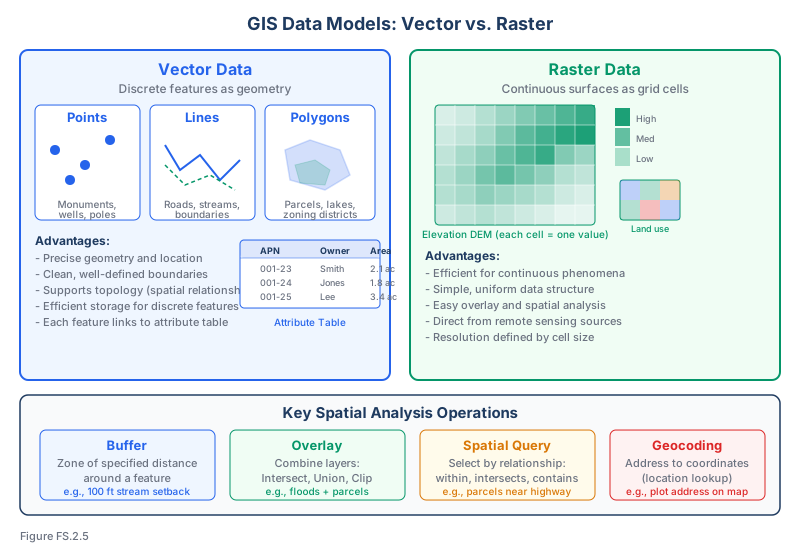
Vector data represents features as discrete geometric elements:
| Feature Type | Representation | Examples |
|---|---|---|
| Points | X, Y coordinate pairs | Survey monuments, well locations, utility poles |
| Lines | Connected sequences of points | Roads, streams, utility lines, boundary lines |
| Polygons | Closed areas defined by lines | Parcels, lakes, building footprints, zoning districts |
Advantages of vector data:
- Precise geometry and location
- Efficient storage for discrete features
- Clean, well-defined boundaries
- Supports topology (spatial relationships between features)
Raster data represents the world as a grid of cells (pixels), each with a value:
| Type | Cell Value Represents | Examples |
|---|---|---|
| Continuous | A measured value | Elevation (DEM), temperature, slope |
| Discrete | A category or class | Land use, soil type, land cover |
| Image | Color/reflectance values | Aerial photography, satellite imagery |
Advantages of raster data:
- Efficient for continuous phenomena (elevation, temperature)
- Simple data structure
- Easy to perform overlay and spatial analysis
- Readily available from remote sensing sources
Attribute Data
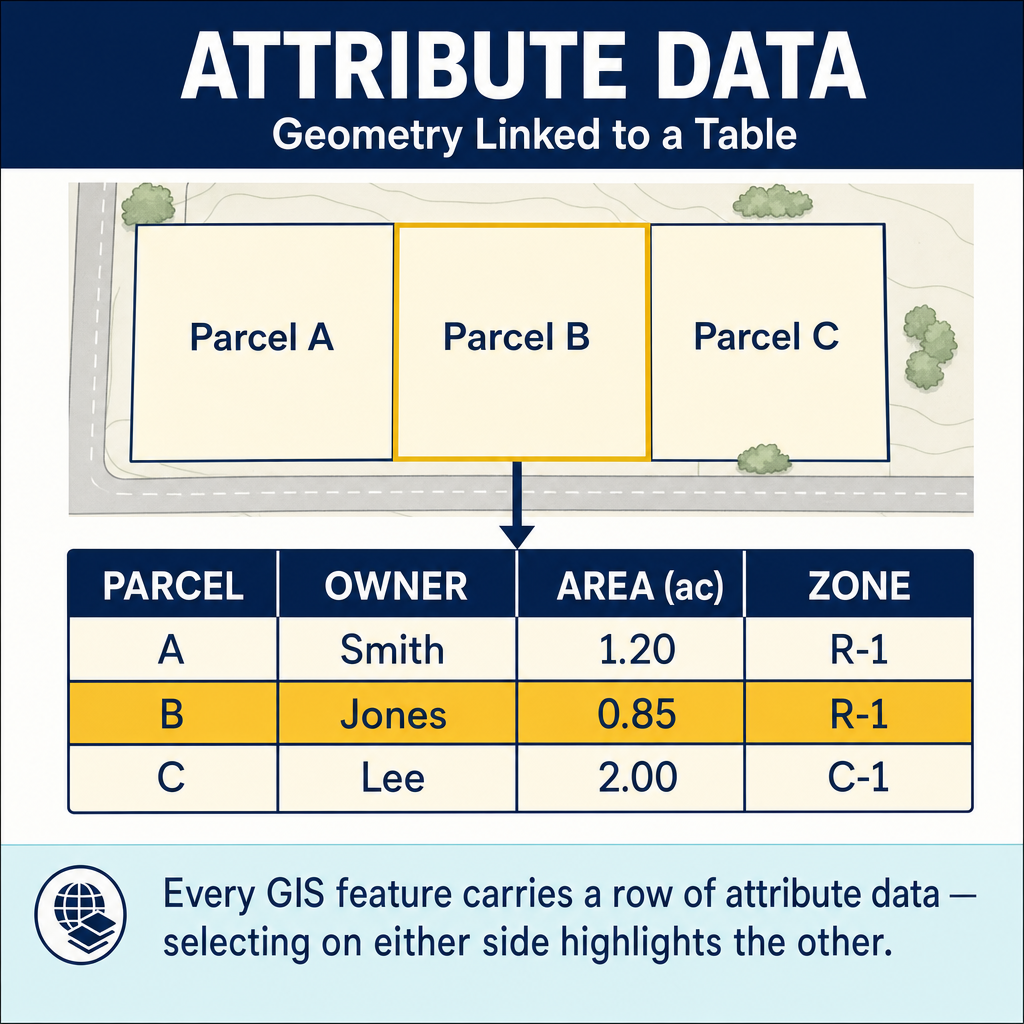
Every spatial feature in a GIS has associated attribute data stored in a table (database):
- A parcel polygon might have attributes: owner name, APN, area, zoning, land use, assessed value
- A road line might have attributes: road name, classification, speed limit, surface type, width
- A survey monument point might have attributes: monument type, coordinates, datum, survey date, surveyor
Attributes are linked to features through a unique identifier (feature ID), enabling queries like "show me all parcels larger than 5 acres" or "highlight all roads with speed limits above 45 mph."
Spatial Analysis Operations
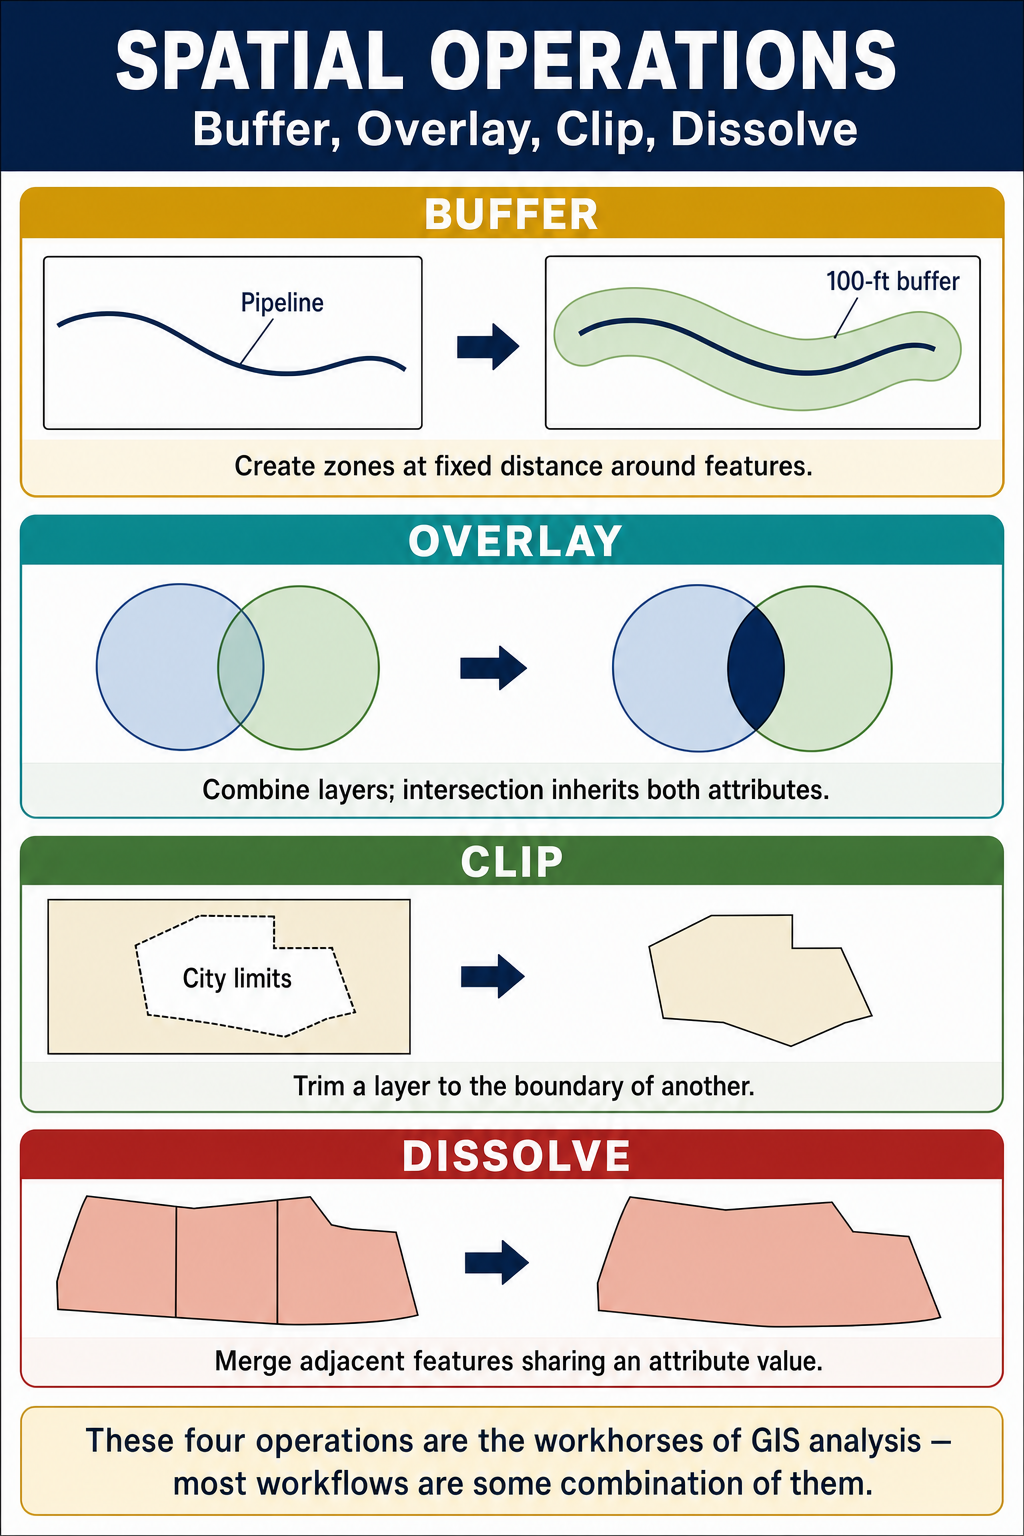
Buffer: Creates a zone of specified distance around a feature.
- Example: 100-foot buffer around a stream to identify setback areas
- Buffers can be applied to points, lines, or polygons
Overlay: Combines two or more layers to create a new layer showing where features intersect.
- Intersect: Retains only the areas where both layers overlap
- Union: Retains all areas from both layers
- Clip: Cuts one layer to the boundary of another
- Example: Overlaying flood zones with parcel data to identify affected properties
Spatial query: Selects features based on their spatial relationship to other features.
- "Select all parcels within 500 feet of the proposed highway"
- "Find all fire hydrants within this subdivision"
- Relationships include: within, contains, intersects, touches, crosses
Geocoding: Converting addresses or place names to geographic coordinates (points on a map).
Network analysis: Finding shortest paths, service areas, or optimal routes along a network (roads, utilities, pipelines).
Coordinate Systems and Projections in GIS
GIS data must have a defined coordinate reference system (CRS) to be displayed and analyzed correctly:
- All layers in a GIS project should use the same coordinate system or be reprojected to match
- Common CRS for US surveying: State Plane (by zone) and UTM (by zone)
- On-the-fly projection allows GIS software to display layers with different CRS together, but the underlying data retains its native CRS
- Datum transformations are required when converting between datums (e.g., NAD 27 to NAD 83)
Surveying Data in GIS
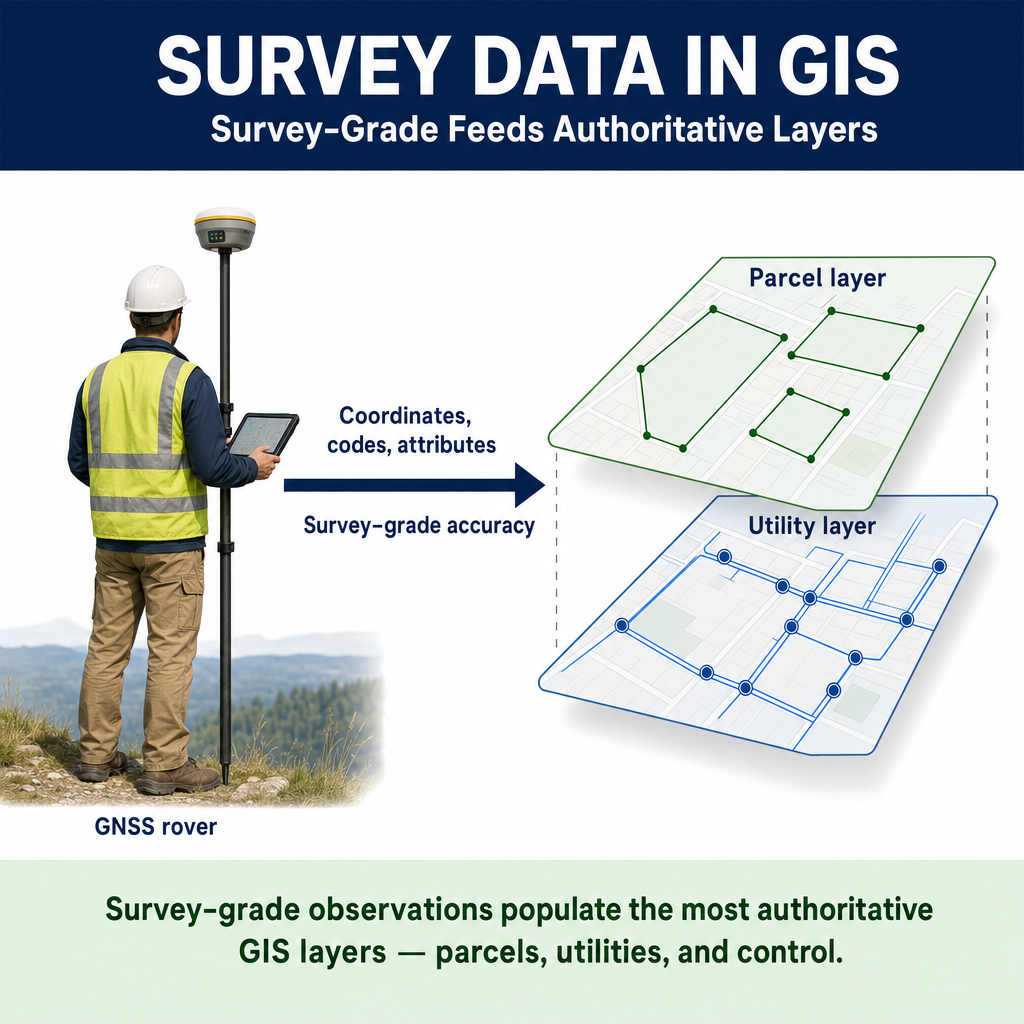
Surveying provides the authoritative spatial framework for GIS:
- Control points define the coordinate reference for the GIS database
- Boundary surveys create the parcel layer -- the foundation of the cadastral GIS
- Topographic surveys contribute elevation data, contours, and feature locations
- As-built surveys update the GIS with constructed infrastructure locations
- GNSS data provides georeferenced positions for any feature
Quality considerations: Survey data is typically more accurate than most GIS data. When integrating survey data into GIS, it is important to maintain metadata about accuracy, date of collection, and method.
Common wrong path — using GIS parcel layers as authoritative boundary data. County GIS parcel layers are widely available, free, and immediately usable in CAD and GIS software. But they are NOT authoritative boundary sources. Most county parcel layers were built from assessor records, tax parcel descriptions, or digitized subdivision plats — they have positional accuracy typically ranging from a few feet to tens of feet, depending on the county's practices. They are excellent for general context, planning, and tax purposes, but they must never be used as the controlling source for a legal boundary determination. Students (and junior GIS staff) sometimes treat a parcel layer's boundary as "the boundary," producing surveys that perpetuate assessor-map approximations as if they were deed descriptions. The correct approach: use GIS parcel data for planning and context; use the actual recorded deeds, plats, and field evidence as authority for the boundary. Exam questions bait this by asking whether GIS data satisfies a boundary-research requirement — it never does for legal purposes.
Quick retrieval check — try before reading on.
▶A client asks whether you can skip the traditional deed search and just use the county's published GIS parcel layer as the basis for their boundary survey, saving time and money. How do you explain why this cannot substitute for the deed and plat research?
You cannot skip the deed search. County GIS parcel layers are compiled from various sources — assessor records, tax parcel boundaries, digitized subdivision plats — and are intended primarily for tax administration and planning, not for legal boundary determination. Typical positional accuracy ranges from 3 to 30 ft depending on the county's source materials and maintenance practices; that alone makes them unsuitable for a professional boundary survey.
More importantly, the GIS layer does not capture the legal evidence needed for a defensible boundary: it does not show senior/junior conveyance dates, easements of record, prior survey records, the chain of title, or the original plat's monumentation. A surveyor relying on GIS data alone risks perpetuating assessor-map errors as if they were deed descriptions, and is exposed to professional liability if the "boundary" later turns out to disagree with the recorded documents. The right approach: use GIS data as context (understanding neighboring properties, regional setting, and potential issues) but perform full records research (deeds, plats, prior surveys, title report) to establish the legal boundary. The client pays for professional research, not GIS downloads.
Exam Tips
- Vector data represents discrete features (points, lines, polygons); raster data represents continuous surfaces (grids of cells)
- Attribute data is the non-spatial information associated with each feature (stored in tables)
- A buffer creates a zone around a feature; overlay combines layers; spatial query selects based on location
- All GIS data requires a defined coordinate reference system -- mixing CRS without transformation causes errors
- Surveying provides the highest-accuracy spatial data for GIS databases
- The FS exam may test your understanding of vector vs. raster, basic spatial analysis operations, or how survey data integrates with GIS
- Topology in GIS defines spatial relationships (adjacency, connectivity, containment) between features
- Know the difference between GIS (analysis and data management) and CAD (design and drafting)
Related Test Topics
- CAD and BIM Applications (Topic 2.4)
- Digital Terrain Models (Topic 2.6)
- Map Concepts and Cartography (Topic 2.1)
- State Plane Coordinates (Module 4, Topic 4.6)
Further Reading
Authoritative sources for deeper study
Penn State GEOG 482 — The Nature of Geographic Information — Open courseware on map projections, datums, and geospatial data fundamentals.
FGDC Geospatial Positioning Accuracy Standards — National standard for positional accuracy reporting (NSSDA).
NGS Geodetic Glossary (1986, NOAA repository) — Authoritative definitions for geodetic, GNSS, and surveying terms.
Last updated: 2026-04-17