FS Exam Preparation
Comprehensive preparation for the Fundamentals of Surveying (FS) exam. 7 modules covering all 7 exam domains with 60 in-depth topics.
Module 1: Surveying Processes & Methods
Module 2: Mapping Processes & Methods
Module 3: Boundary Law & Real Property
Module 4: Surveying Principles & Geodesy
Module 5: Survey Computations
Module 6: Business Concepts
Digital Terrain Models
Learning Objectives
After completing this topic, you should be able to:
- Define DTM, DEM, and DSM and distinguish between them
- Explain how a TIN is constructed from survey points
- Describe the role of breaklines in terrain modeling
- Understand contour generation from digital surfaces
- Calculate earthwork volumes using the average end area method
- Identify common applications of digital terrain models
Overview
A Digital Terrain Model (DTM) is a mathematical representation of the earth's surface used for analysis, design, and visualization. DTMs are created from survey points, LiDAR data, photogrammetric measurements, or other elevation sources. They enable automated contour generation, volume computation, slope analysis, drainage modeling, and engineering design.
Understanding DTM concepts is essential for the FS exam because terrain modeling bridges the gap between field data collection and engineering applications.
Key Concepts
Terminology
| Term | Definition |
|---|---|
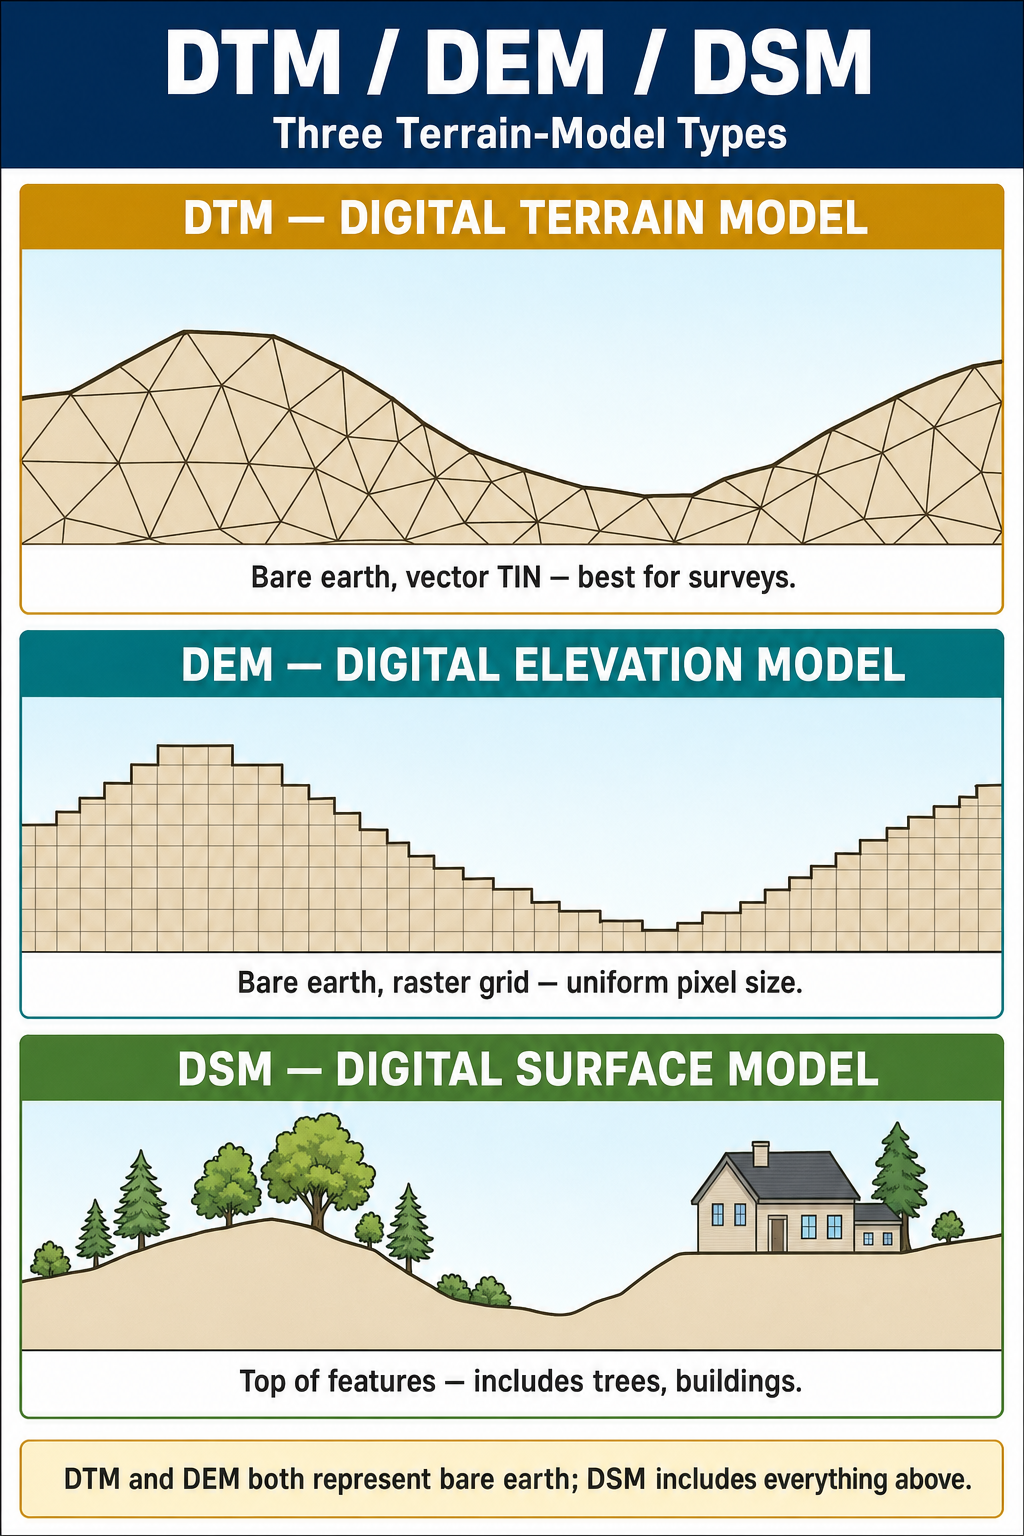
| DTM (Digital Terrain Model) | Represents the bare earth surface, including breaklines and mass points that define terrain features |
| DEM (Digital Elevation Model) | A regularly spaced grid of elevation values; a specific type of DTM |
| DSM (Digital Surface Model) | Represents the top surface including vegetation, buildings, and other above-ground features |
| TIN (Triangulated Irregular Network) | A surface model built from triangles connecting irregularly spaced points |
Key distinction: A DEM represents only the bare ground, while a DSM includes the tops of trees, buildings, and other features. A DTM is the broader term that includes breaklines and feature data beyond simple elevations.
TIN Construction
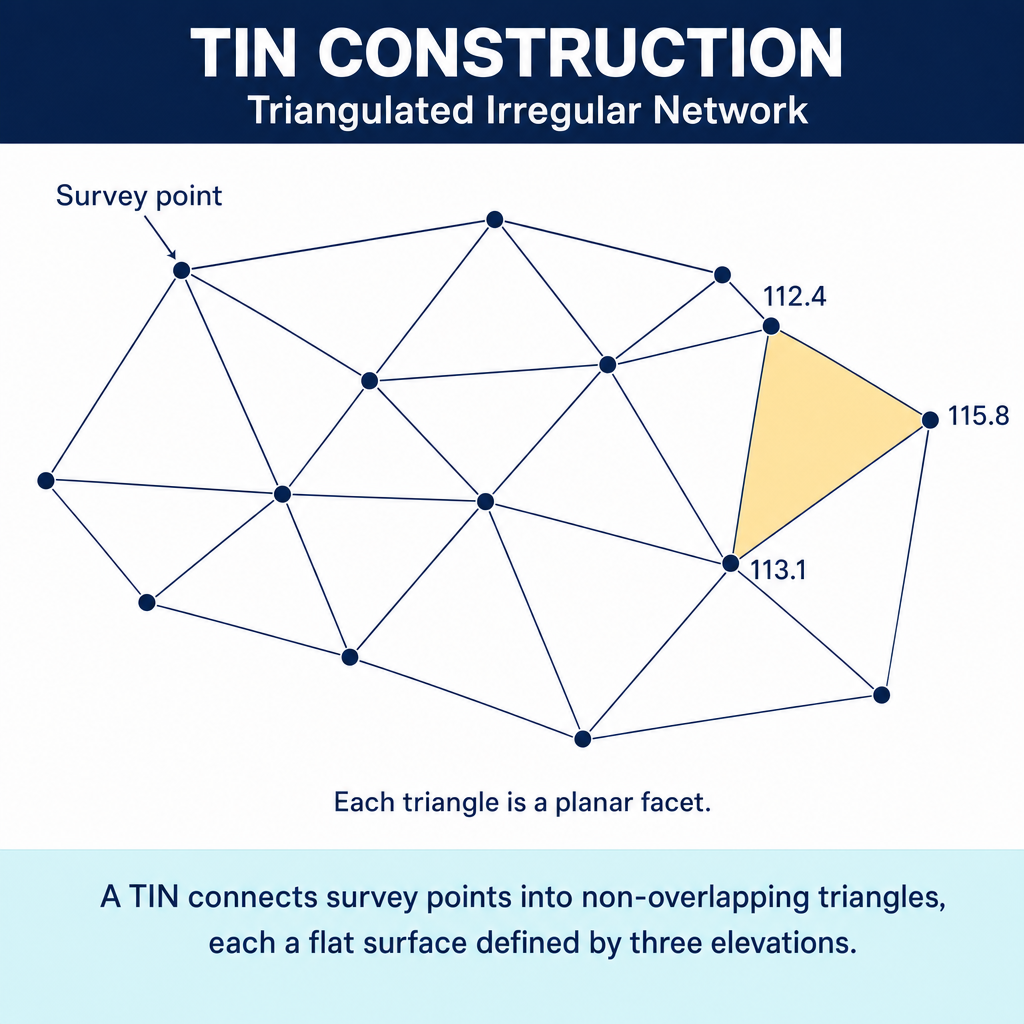
A Triangulated Irregular Network (TIN) is the most common surface model in surveying and civil engineering.
How TINs are built:
- Start with a set of survey points (each with X, Y, Z coordinates)
- Connect the points with triangles using Delaunay triangulation (maximizes the minimum angle of all triangles to avoid long, thin triangles)
- Each triangle face represents a planar surface between three points
- The terrain surface is approximated by the collection of all triangle faces
Advantages of TIN over grid:
- Adapts to terrain complexity -- closely spaced points in complex areas, widely spaced in flat areas
- Honors survey points exactly (the surface passes through each measured point)
- Incorporates breaklines as triangle edges
- More efficient storage for irregular data
The Role of Breaklines
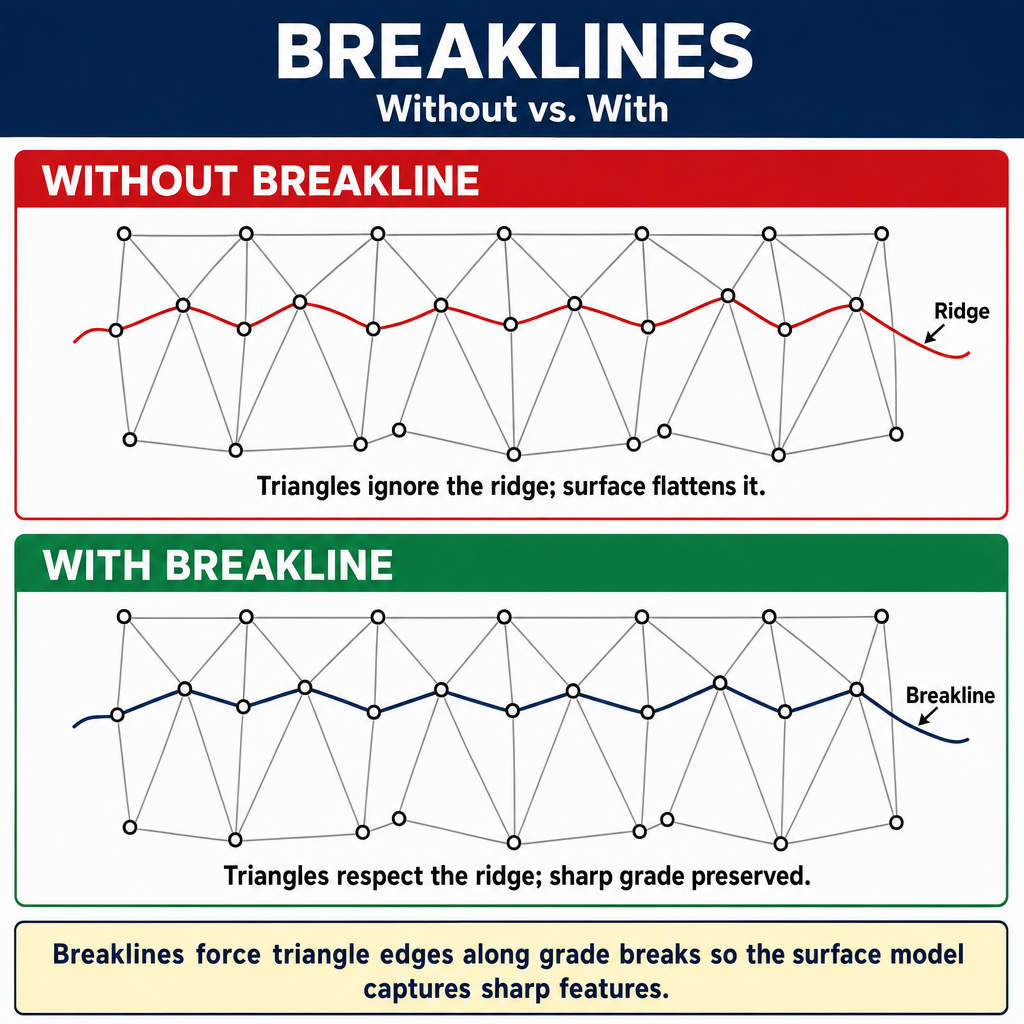
Breaklines are critical for accurate terrain modeling. They are lines that represent abrupt changes in the terrain surface.
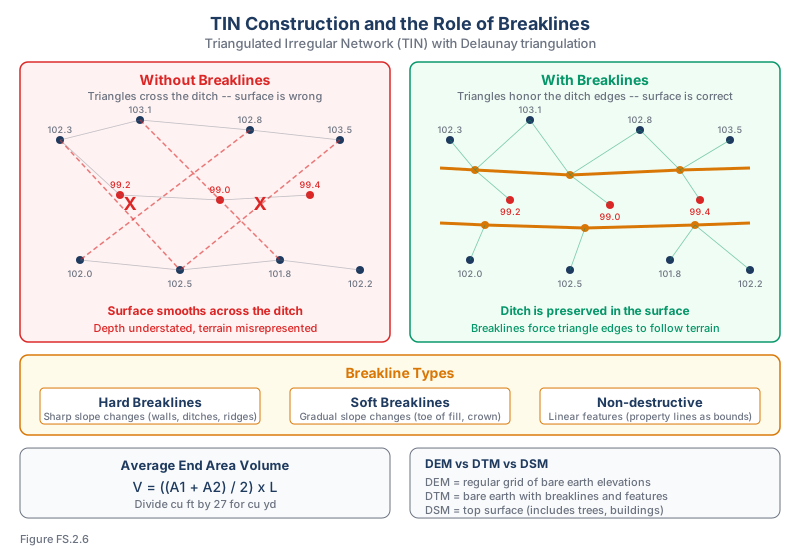
Without breaklines: The TIN may create triangle edges that cross terrain features (ridges, ditches, walls), producing an inaccurate surface.
With breaklines: The TIN is constrained so that triangle edges follow the breaklines, preserving the terrain feature.
Types:
- Hard breaklines: Sharp, abrupt changes in slope (top/bottom of wall, edge of pavement, ridge line, ditch center)
- Soft breaklines: Gradual changes in slope (toe of fill slope, crown of road)
- Non-destructive breaklines: Define linear features without requiring a sharp slope change (property lines as boundaries)
Example: A drainage channel is 2 feet deep and 10 feet wide. Without breaklines along the top edges and the channel bottom, the TIN would smooth across the channel, understating its depth and misrepresenting the terrain.
Contour Generation
Contours are generated from a DTM by:
- For each desired contour elevation, the algorithm finds where that elevation intersects the TIN triangle edges
- These intersection points are connected to form the contour line
- The process repeats for each contour interval
Quality considerations:
- Contour quality depends on the density and distribution of survey points
- Breaklines significantly improve contour accuracy at terrain features
- Contour smoothing algorithms may be applied for visual appearance, but must not shift contours beyond the accuracy requirements
Earthwork Volume Computation
DTMs enable efficient volume calculations for grading projects.
Average End Area Method:
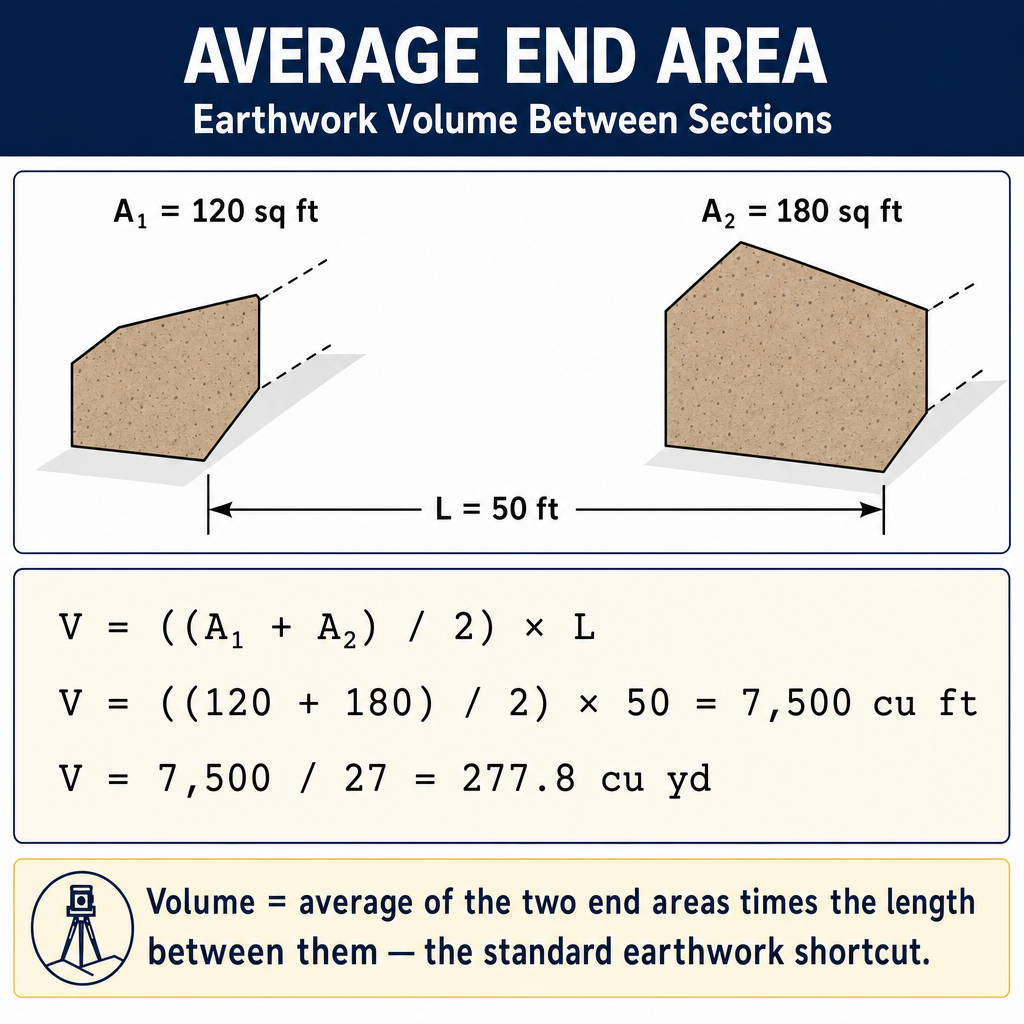
The most common method for linear projects (roads, channels):
Where A1 and A2 are the cross-sectional areas at two adjacent stations, and L is the distance between them.
Example: Station 1+00 has a fill area of 120 sq ft. Station 2+00 has a fill area of 180 sq ft. Distance = 100 ft.
(Divide cubic feet by 27 to get cubic yards.)
Prismoidal Formula (more accurate):
Where Am is the area of the cross-section at the midpoint. This method is more accurate but requires additional computation.
Surface-to-surface comparison: For area grading (non-linear projects), volume is computed by comparing the existing ground DTM to the design surface DTM. The volume between the two surfaces is calculated cell by cell or triangle by triangle.
Common wrong path — more points always equal a better model. Students sometimes assume that denser point data automatically produces a better terrain model. Not always. Without breaklines, a dense scatter of random points can still produce a worse model than a sparse but well-chosen set of points plus breaklines. Why? Because the TIN triangulation algorithm doesn't know where the ridges, valleys, and abrupt features are — it just connects points in whatever Delaunay-optimal pattern it finds. A dense scatter across a drainage ditch may still have triangles that cross the ditch bottom, producing a smoothed surface that misrepresents the terrain. A sparse set of points with breaklines along the ditch top and bottom forces triangles to respect those edges and produces a more accurate surface. The lesson: density helps, but breaklines always help more for features. Prioritize breakline collection over dense sampling, especially at terrain breaks.
Quick retrieval check — try before reading on.
▶A 10-acre site has a drainage ditch running through it. Two survey crews collect topographic data: Crew A collects 500 randomly placed points; Crew B collects 300 points plus a breakline along the ditch top and bottom. Which data set is likely to produce a more accurate terrain model of the ditch, and why?
Crew B's data set is likely more accurate, despite having fewer points. The breakline along the ditch forces the TIN algorithm to respect the ditch's geometry, ensuring that triangle edges follow the top edges and bottom of the ditch rather than crossing them arbitrarily. A dense scatter of points alone (Crew A) does not communicate to the TIN algorithm where abrupt features are — the triangulation may still average across the ditch, producing a smoothed, incorrect representation.
The trade-off: Crew B's breakline represents just a small portion of the total data, but it carries disproportionate information about terrain geometry. This is why "collect breaklines along all significant features" is a universal topographic-survey rule, not an optional enhancement. Density helps between features; breaklines are essential at features. For a site with a drainage ditch, Crew A's 500 random points may miss the ditch entirely (if no point happened to land in the channel bottom), while Crew B's breakline definitively captures the ditch's shape regardless of point density elsewhere.
Applications of DTMs
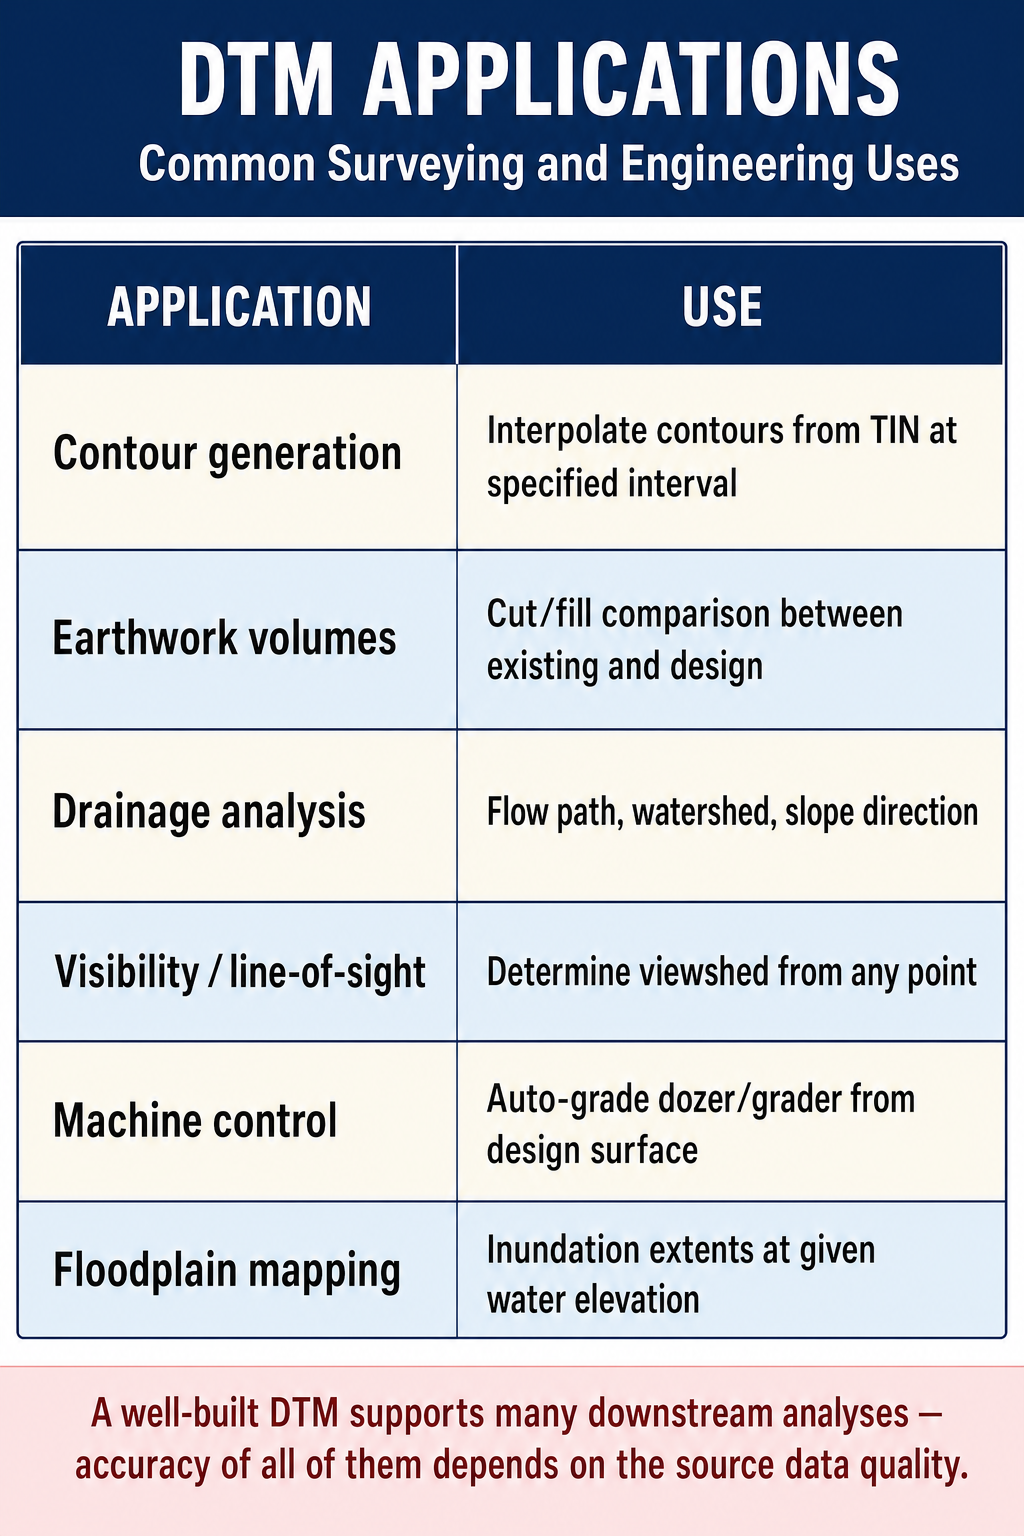
| Application | How DTM Is Used |
|---|---|
| Contour mapping | Generate contour lines for topographic maps |
| Earthwork volumes | Compute cut and fill quantities for grading |
| Slope analysis | Calculate slope angles and identify steep areas |
| Drainage analysis | Determine flow paths and drainage basins |
| Line of sight | Analyze visibility between points on the terrain |
| Cross-section generation | Extract profiles at any orientation through the model |
| Floodplain mapping | Model water surface elevations against terrain |
| Design visualization | 3D rendering of proposed improvements on existing terrain |
Exam Tips
- TIN is the most common surface model in surveying; it honors survey points exactly
- Breaklines are essential for accurate terrain modeling at abrupt slope changes -- without them, the surface smooths incorrectly
- DEM is a regular grid; TIN is an irregular triangulated network -- know the distinction
- DSM includes trees and buildings; DEM/DTM represents bare earth
- The average end area formula is the most common volume calculation method: V = ((A1 + A2) / 2) x L
- Convert cubic feet to cubic yards by dividing by 27
- Delaunay triangulation maximizes the minimum angle of all triangles
- The FS exam commonly tests volume computation using the average end area method
- Contour lines generated from a DTM are only as accurate as the underlying data
Related Test Topics
- Topographic Surveys (Module 1, Topic 1.7)
- Plan and Profile Drawings (Topic 2.2)
- Construction Surveys and Staking (Module 1, Topic 1.8)
- Remote Sensing, LiDAR, and UAS (Topic 2.8)
Further Reading
Authoritative sources for deeper study
Wolf & Ghilani, Elementary Surveying — An Introduction to Geomatics (13th Ed., 2012) — Comprehensive surveying text covering instruments, field procedures, and computations.
Penn State GEOG 482 — The Nature of Geographic Information — Open courseware on map projections, datums, and geospatial data fundamentals.
FGDC Geospatial Positioning Accuracy Standards — National standard for positional accuracy reporting (NSSDA).
Last updated: 2026-04-17