FS Exam Preparation
Comprehensive preparation for the Fundamentals of Surveying (FS) exam. 7 modules covering all 7 exam domains with 60 in-depth topics.
Module 1: Surveying Processes & Methods
Module 2: Mapping Processes & Methods
Module 3: Boundary Law & Real Property
Module 4: Surveying Principles & Geodesy
Module 5: Survey Computations
Module 6: Business Concepts
Least Squares Adjustments
Learning Objectives
After completing this topic, you should be able to:
- Explain the principle of least squares adjustment
- Distinguish between parametric and conditional adjustments
- Define redundancy (degrees of freedom) in a measurement network
- Apply weights to observations based on measurement quality
- Interpret adjustment results including residuals and standard deviations
- Compute a simple weighted mean as a basic least squares application
Overview
Least squares adjustment is the mathematically rigorous method for distributing measurement errors in a network of observations. Unlike the compass or transit rule, least squares uses all available information -- measurement precision, network geometry, and redundant observations -- to produce the most probable values of the unknowns. While the FS exam rarely requires you to perform a full matrix-based least squares adjustment, you must understand the concepts, terminology, and simple applications.
Key Concepts
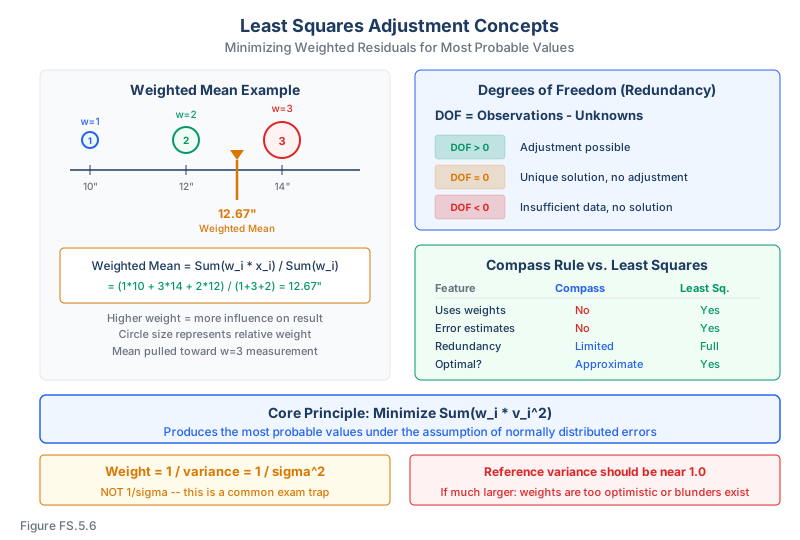
The Principle of Least Squares
The least squares method finds the set of adjusted values that minimizes the sum of the squares of the weighted residuals:
Minimize: Sum of (w_i * v_i^2)
Where:
- v_i = residual (adjusted value minus observed value) for observation i
- w_i = weight of observation i
This produces the most probable values under the assumption that errors follow a normal distribution.
Why Least Squares?
| Feature | Compass/Transit Rule | Least Squares |
|---|---|---|
| Uses measurement weights | No | Yes |
| Uses network geometry | No | Yes |
| Handles redundant observations | Limited | Fully |
| Produces error estimates | No | Yes |
| Mathematically optimal | No | Yes (under normality) |
Key Terminology
- Observations: The measured quantities (distances, angles, elevation differences)
- Unknowns (parameters): The values to be determined (coordinates, elevations)
- Redundancy (degrees of freedom): Number of observations minus number of unknowns. Must be greater than zero for adjustment to be possible
- Residuals: The corrections applied to each observation (v = adjusted - observed)
- Weight: A measure of the relative precision of an observation. Higher weight = more precise = more influence on the solution
Degrees of Freedom
Degrees of freedom = number of observations - number of unknowns
- If degrees of freedom = 0: unique solution, no adjustment possible
- If degrees of freedom > 0: redundant observations allow adjustment and error estimation
- If degrees of freedom < 0: insufficient observations, no solution possible
Example: A level network with 10 measured elevation differences and 7 unknown elevations has 10 - 7 = 3 degrees of freedom.
Weights
Weights are typically assigned based on the inverse of the variance of the observation:
w = 1 / sigma^2
Where sigma is the standard deviation of the observation.
For leveling: Weight is often proportional to 1/distance (longer lines get less weight)
For angles: Weight may be proportional to the number of repetitions
For distances: Weight may be based on the EDM specifications
Weighted Mean (Simplest Least Squares)
The weighted mean is the simplest application of least squares. Given multiple measurements of the same quantity:
Weighted mean = Sum(w_i * x_i) / Sum(w_i)
Example: Three measurements of an angle:
- 45 32' 10" (weight 1, measured once)
- 45 32' 14" (weight 3, measured three times)
- 45 32' 12" (weight 2, measured twice)
Weighted mean = (1 * 10 + 3 * 14 + 2 * 12) / (1 + 3 + 2) = 76 / 6 = 12.67"
So the weighted mean angle = 45 32' 12.7"
Common wrong path — weight proportional to standard deviation, not variance. Students sometimes assign weights proportional to 1/σ instead of 1/σ². This produces subtly wrong weighted means whenever the σ values differ by more than a small amount. Intuition: doubling precision should give four times the influence, not twice — because what matters is the variance, not its square root. On the FS exam, a weighted-mean question that gives you standard deviations is really asking you to compute weights as 1/σ². If two observations have σ = 1 mm and σ = 2 mm, their weight ratio is 4:1, not 2:1. This gets the more precise observation the influence it deserves.
Quick retrieval check — try before reading on.
▶Two independent measurements of an elevation difference give +2.346 m (σ = 2 mm) and +2.351 m (σ = 4 mm). What is the weighted mean?
Weights: w₁ = 1/4 = 0.25, w₂ = 1/16 = 0.0625. (Using σ in mm, weights in 1/mm².) Weighted mean = (0.25 × 2.346 + 0.0625 × 2.351) / (0.25 + 0.0625) = (0.5865 + 0.14694) / 0.3125 = 0.73344 / 0.3125 = 2.347 m. The simple arithmetic mean would be (2.346 + 2.351)/2 = 2.3485 m — notably farther from the more precise measurement. The factor-of-4 weight ratio (from the factor-of-2 σ difference) pulls the answer toward the σ = 2 mm measurement, which is what we want: more precise observations should dominate.
Post-Adjustment Statistics
After adjustment, key quality indicators include:
- Reference variance (variance factor): Sum(w_i * v_i^2) / degrees of freedom -- should be close to 1.0 if weights are properly assigned
- Standard deviation of unit weight: Square root of the reference variance
- Residuals: Should be randomly distributed with no systematic patterns
- Confidence intervals: Provide a range within which the true value is expected to fall
What FS Candidates Actually Need to Do
For the FS exam, least squares usually appears in one of four forms:
- Vocabulary and interpretation. Know observation, residual, weight, variance, redundancy, degree of freedom, standard deviation, and variance factor.
- Weighted mean. Convert the stated precision into weights, then compute Sum(wx) / Sum(w).
- Degrees of freedom. Count observations and unknowns. If observations do not exceed unknowns, there is no redundancy for adjustment statistics.
- Quality diagnosis. Large residuals, systematic residual patterns, or a variance factor far from 1.0 suggest a bad model, bad weights, or a blunder.
The exam is unlikely to require a full normal-equation matrix adjustment, but it can ask what least squares does differently from compass-rule balancing. The key difference is that least squares uses observation weights and network redundancy to estimate the most probable values and their uncertainty.
Interpreting Residuals
Residuals are not automatically mistakes. A small residual is the normal correction needed to make redundant measurements agree. A large residual is a warning sign.
Use this decision pattern:
- One large residual may indicate a blunder in one observation.
- Residuals that grow with distance may indicate a distance-scale or ppm problem.
- Residuals that point the same direction may indicate a datum, control, or setup bias.
- Random small residuals usually indicate normal measurement noise.
This is why least squares is a quality-control tool, not just a coordinate calculator.
Exam Tips
- The FS exam tests concepts more than computation for least squares -- know the terminology
- A weighted mean problem is the most likely computational least squares problem on the FS exam
- Degrees of freedom = observations minus unknowns -- always count both carefully
- Higher weight means the observation has more influence on the adjusted value
- Weight is proportional to 1/variance, not 1/standard deviation
- If all weights are equal, the weighted mean reduces to the arithmetic mean
- Residuals should be small and randomly distributed -- large or systematic residuals indicate blunders or model errors
- Least squares requires redundancy -- you cannot adjust without more observations than unknowns
Related Test Topics
- Traverse Adjustments (Topic 5.3)
- Error Analysis and Propagation (Topic 7.4)
- Measurement Accuracy and Precision (Topic 7.5)
- Data Analysis and Quality Control (Topic 7.6)
Further Reading
Authoritative sources for deeper study
Ghilani & Wolf, Adjustment Computations (5th Ed., 2010) — Authoritative treatment of least-squares adjustment, matrix algebra, normal equations, and least-squares formulation for surveying networks.
Wolf & Ghilani, Elementary Surveying — An Introduction to Geomatics (13th Ed., 2012) — Comprehensive surveying text covering instruments, field procedures, and computations.
FGDC Geospatial Positioning Accuracy Standards — National standard for positional accuracy reporting (NSSDA).
Last updated: 2026-04-17