FS Exam Preparation
Comprehensive preparation for the Fundamentals of Surveying (FS) exam. 7 modules covering all 7 exam domains with 60 in-depth topics.
Module 1: Surveying Processes & Methods
Module 2: Mapping Processes & Methods
Module 3: Boundary Law & Real Property
Module 4: Surveying Principles & Geodesy
Module 5: Survey Computations
Module 6: Business Concepts
Topographic Surveys
Learning Objectives
After completing this topic, you should be able to:
- Define the purpose and products of a topographic survey
- Explain contour lines and their properties
- Describe methods for collecting topographic data
- Understand breaklines and their importance in terrain modeling
- Calculate contour intervals appropriate for the project
- Interpret a topographic map to understand terrain features
Overview
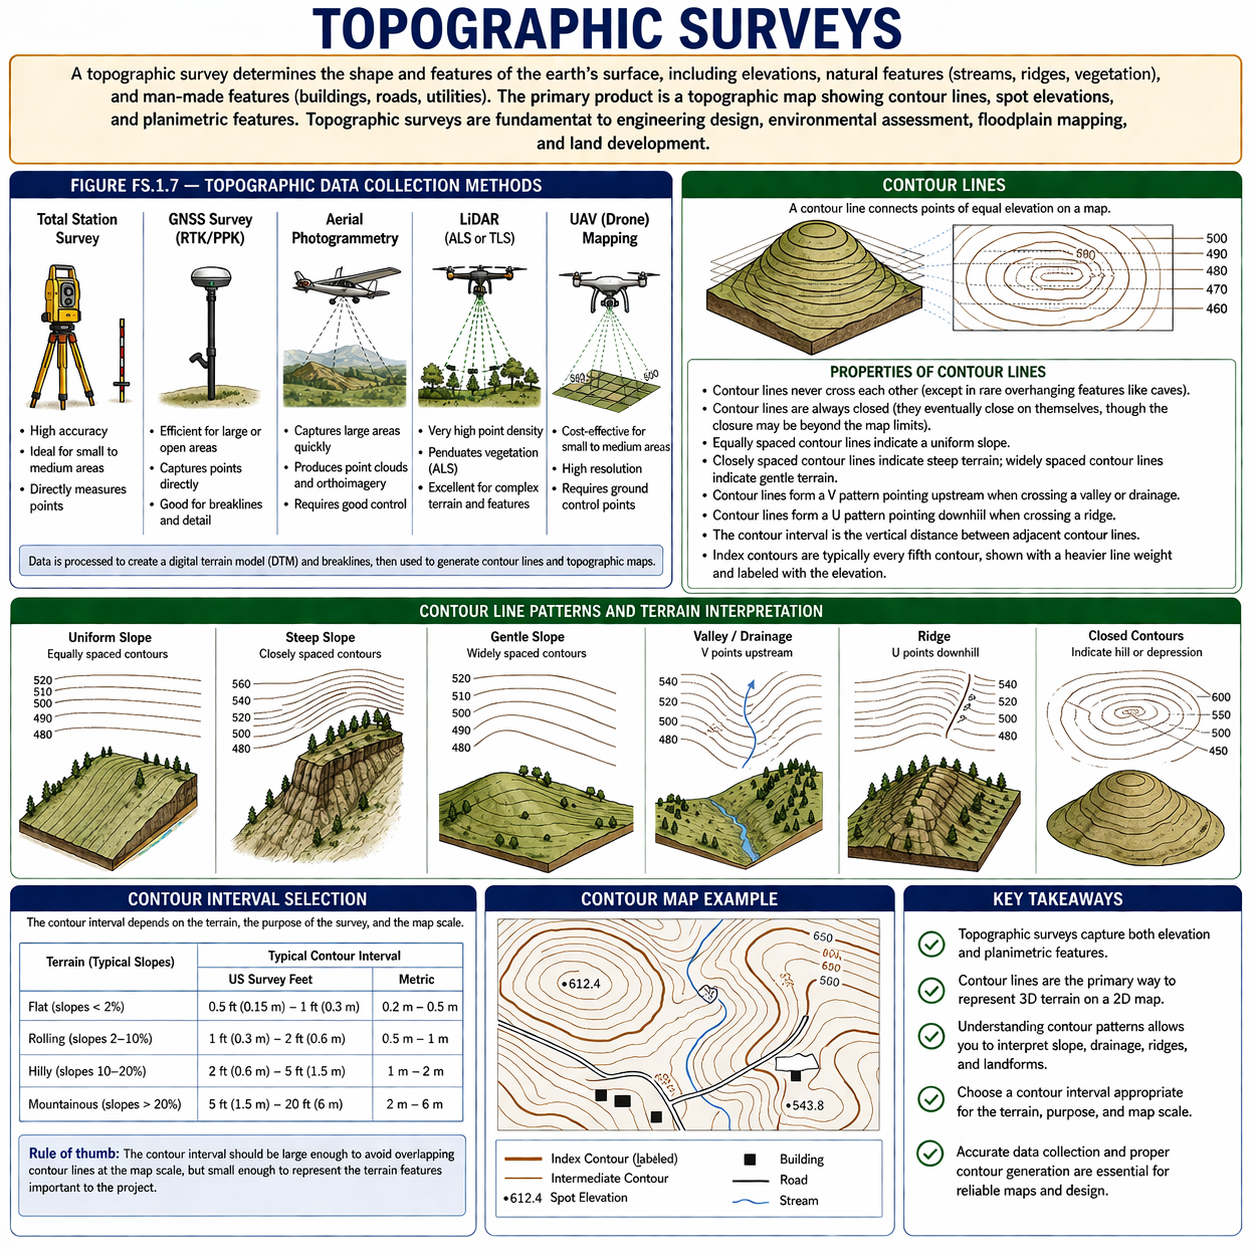
A topographic survey determines the shape and features of the earth's surface, including elevations, natural features (streams, ridges, vegetation), and man-made features (buildings, roads, utilities). The primary product is a topographic map showing contour lines, spot elevations, and planimetric features.
Topographic surveys are fundamental to engineering design, environmental assessment, floodplain mapping, and land development. The FS exam tests your understanding of contour properties, data collection methods, and basic terrain representation.
Key Concepts
Contour Lines
A contour line connects points of equal elevation on a map. Contour lines are the primary means of representing three-dimensional terrain on a two-dimensional surface.
Properties of contour lines:
- Contour lines never cross each other (except in rare overhanging features like caves)
- Contour lines are always closed (they eventually close on themselves, though the closure may be beyond the map limits)
- Equally spaced contour lines indicate a uniform slope
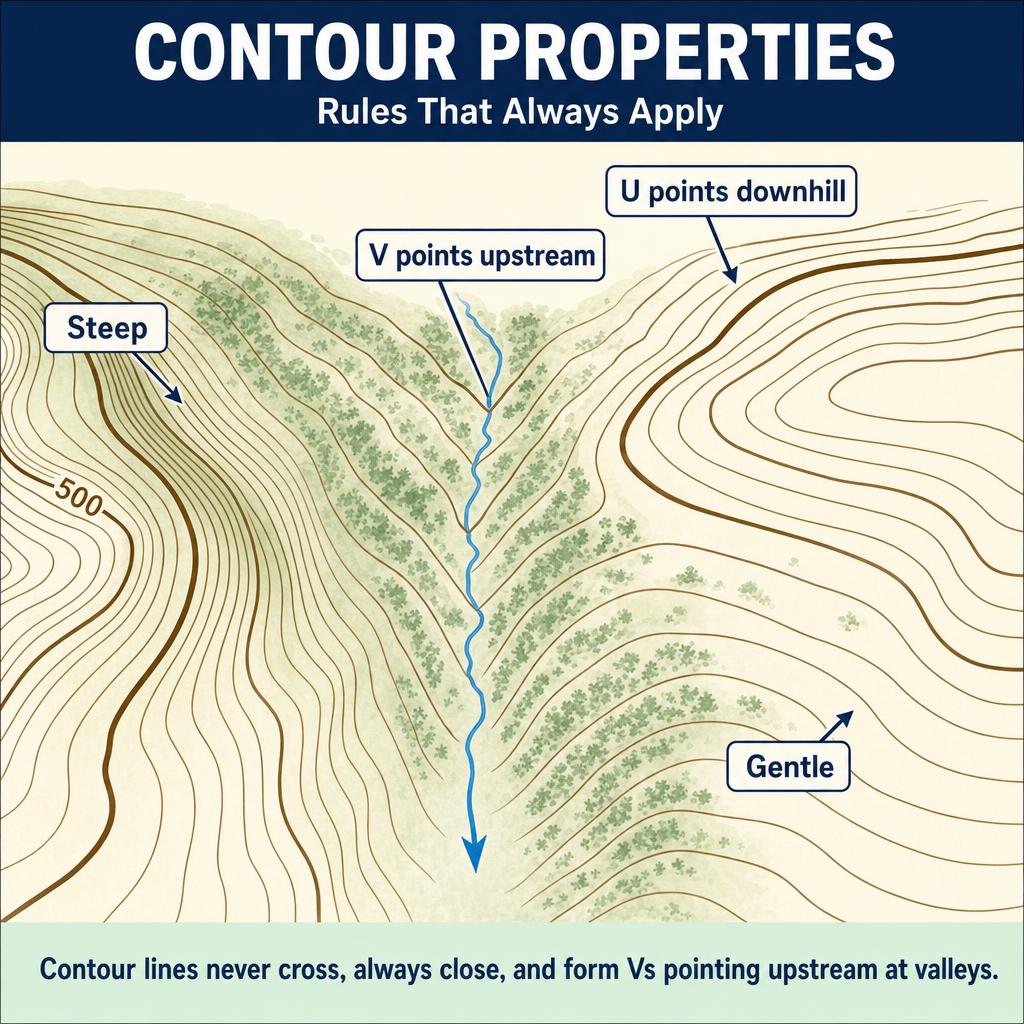
- Closely spaced contour lines indicate steep terrain; widely spaced contour lines indicate gentle terrain
- Contour lines form a V pattern pointing upstream when crossing a valley or drainage
- Contour lines form a U pattern pointing downhill when crossing a ridge
- The contour interval is the vertical distance between adjacent contour lines
- Index contours are typically every fifth contour, shown with a heavier line weight and labeled with the elevation
Contour Interval Selection
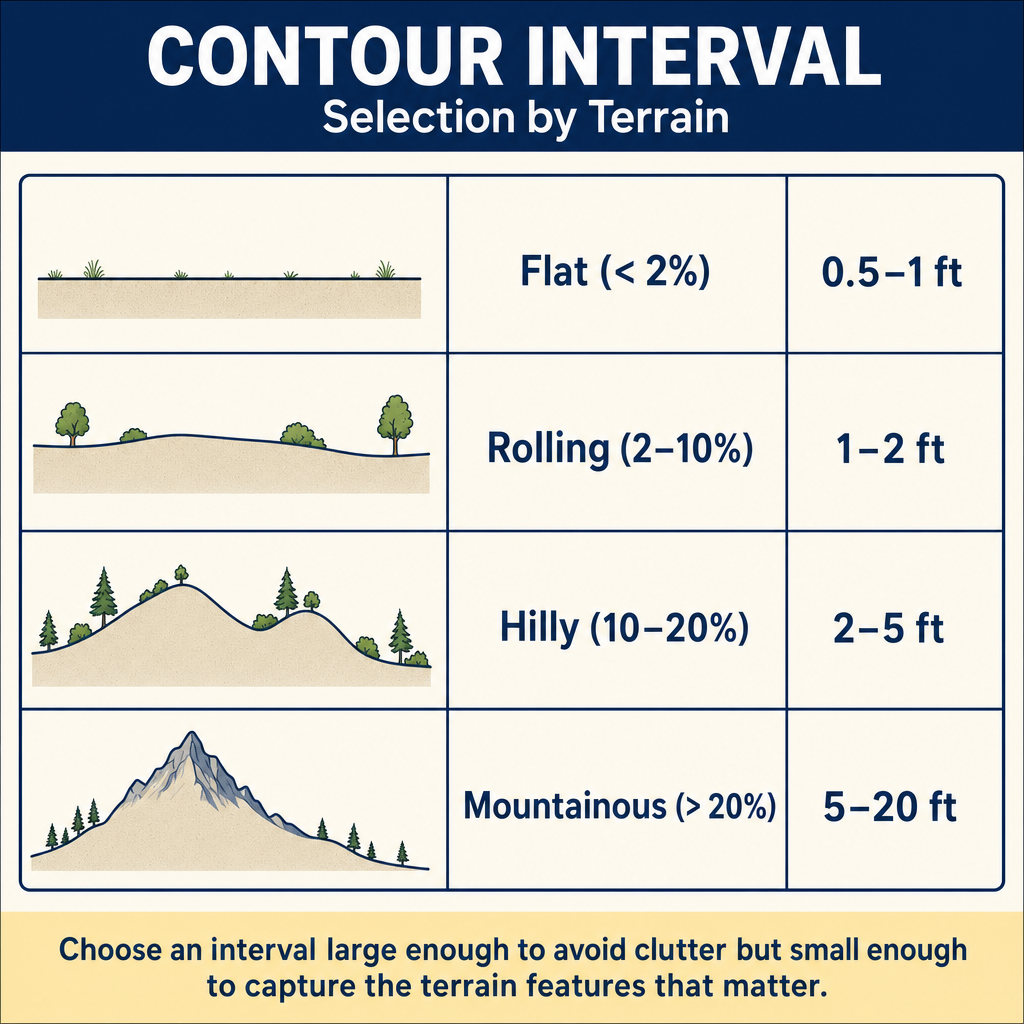
The contour interval depends on the terrain, the purpose of the survey, and the map scale:
| Terrain | Typical Contour Interval |
|---|---|
| Flat (slopes < 2%) | 0.5 ft (0.15 m) to 1 ft (0.3 m) |
| Rolling (slopes 2-10%) | 1 ft (0.3 m) to 2 ft (0.6 m) |
| Hilly (slopes 10-20%) | 2 ft (0.6 m) to 5 ft (1.5 m) |
| Mountainous (slopes > 20%) | 5 ft (1.5 m) to 20 ft (6 m) |
Rule of thumb: The contour interval should be large enough to avoid overlapping contour lines at the map scale, but small enough to represent the terrain features important to the project.
Data Collection Methods
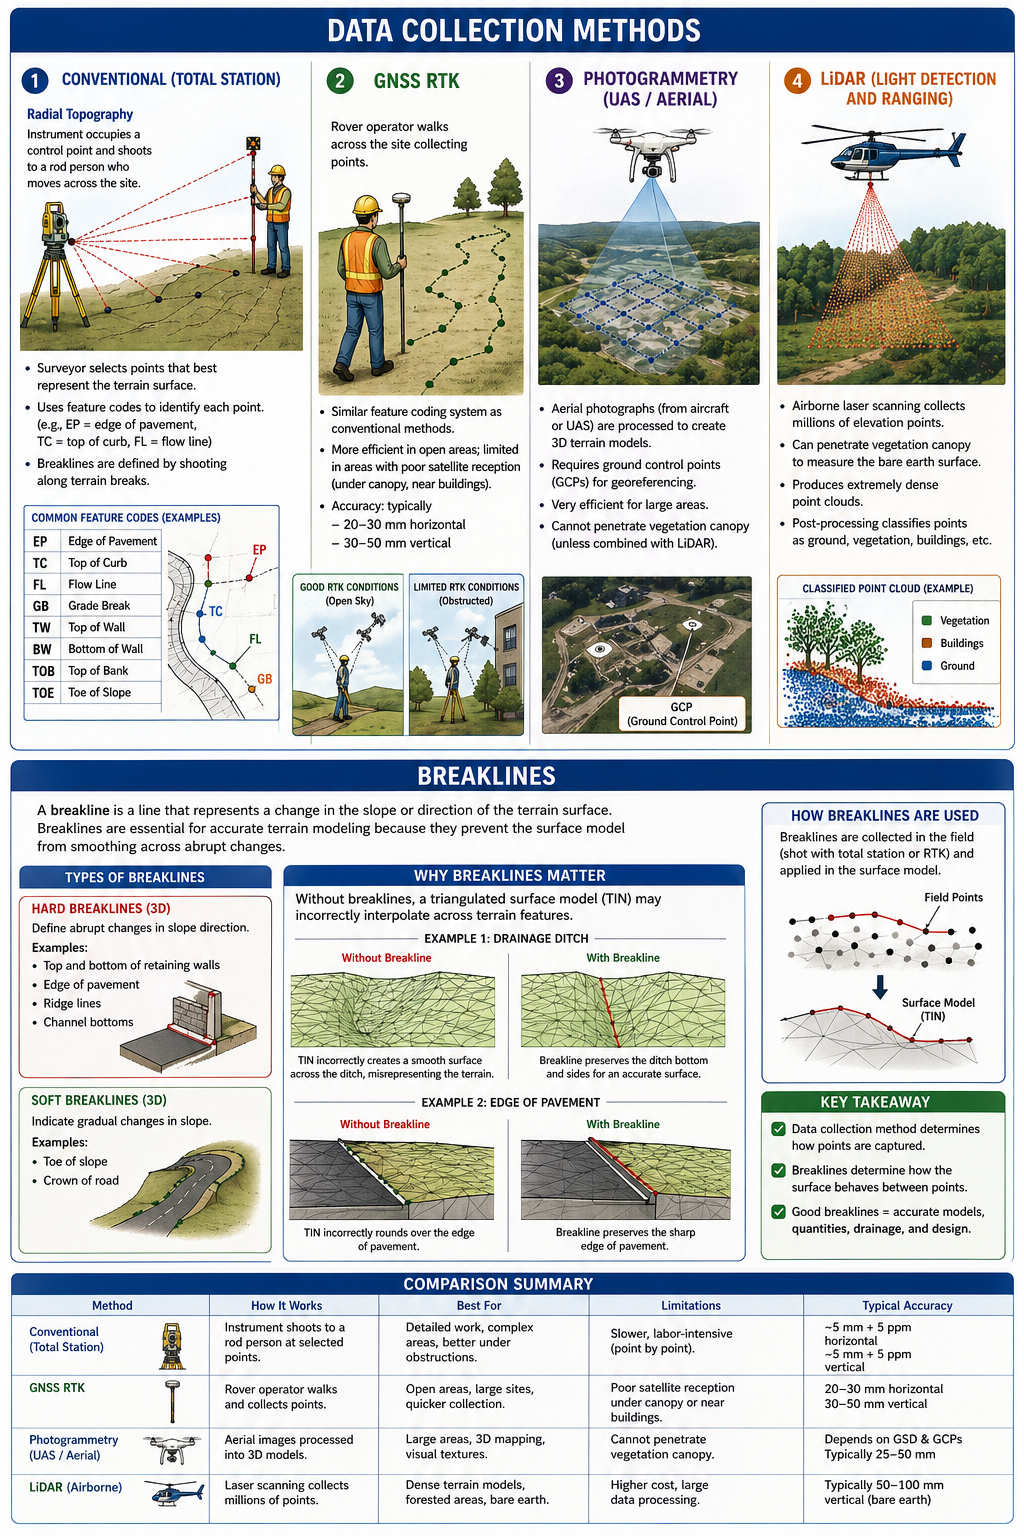
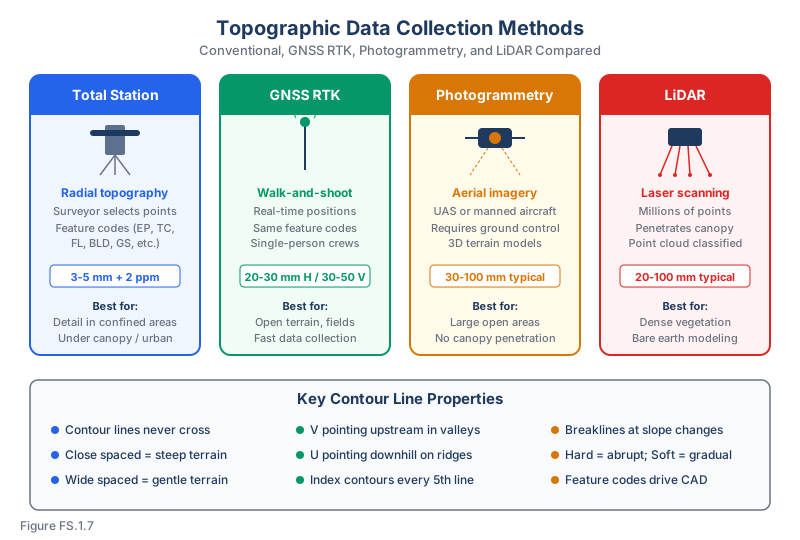
Conventional (total station):
- The surveyor selects points that best represent the terrain surface
- Radial topography: The instrument occupies a control point and shoots to a rod person who moves across the site
- The surveyor uses feature codes to identify each point (e.g., EP for edge of pavement, TC for top of curb, FL for flow line)
- Breaklines are defined by shooting along terrain breaks
GNSS RTK:
- The rover operator walks across the site collecting points
- Similar feature coding system as conventional methods
- More efficient in open areas; limited in areas with poor satellite reception (under canopy, near buildings)
- Accuracy: typically 20-30 mm horizontal, 30-50 mm vertical
Photogrammetry:
- Aerial photographs (from aircraft or UAS) are processed to create 3D terrain models
- Requires ground control points for georeferencing
- Very efficient for large areas
- Cannot penetrate vegetation canopy (unless combined with LiDAR)
LiDAR (Light Detection and Ranging):
- Airborne laser scanning collects millions of elevation points
- Can penetrate vegetation canopy to measure the bare earth surface
- Produces extremely dense point clouds
- Post-processing classifies points as ground, vegetation, buildings, etc.
Breaklines
A breakline is a line that represents a change in the slope or direction of the terrain surface. Breaklines are essential for accurate terrain modeling because they prevent the surface model from smoothing across abrupt changes.
Types of breaklines:
- Hard breaklines (3D): Define abrupt changes in slope direction. Examples: top and bottom of retaining walls, edge of pavement, ridge lines, channel bottoms
- Soft breaklines (3D): Indicate gradual changes in slope. Examples: toe of slope, crown of road
Why breaklines matter: Without breaklines, a triangulated surface model (TIN) may incorrectly interpolate across terrain features. For example, without a breakline along a drainage ditch, the TIN might create a smooth surface across the ditch, misrepresenting the terrain.
Common wrong path — V points downstream, not upstream. One of the most-tested topographic map-reading facts is the direction of the V in contour lines crossing streams. The correct rule: contours form a V pointing UPSTREAM (uphill toward the source of the stream). Students get this backwards half the time because intuition says "water flows downstream and the V should point that way." Wrong — the V points away from where the water is flowing, because contour lines bend upstream as they cross a stream valley (the stream channel is the lowest elevation, so contour lines have to reach up-valley before crossing). Exam questions test this directly with a drainage pattern on a contour map. Always check: if the map shows a stream with arrows indicating flow direction, the V of the contour should point opposite the flow arrow.
Quick retrieval check — try before reading on.
▶On a contour map, you see a V-shaped pattern in the contour lines near a drainage. The apex of the V points north, and stream-flow arrows point south. Does this V represent a valley (stream) or a ridge? Which direction is the water flowing?
Valley/stream — the V points upstream (north), so the water is flowing south (downstream, opposite the V). Contour lines in valleys bend uphill toward the source; the V-apex marks the direction of the upstream water source. If the apex had pointed in the same direction as the stream flow (south), the feature would be a ridge, not a valley — and the pattern would be a U rather than a sharp V. Memorize: V upstream in valleys, U downhill on ridges.
Feature Coding
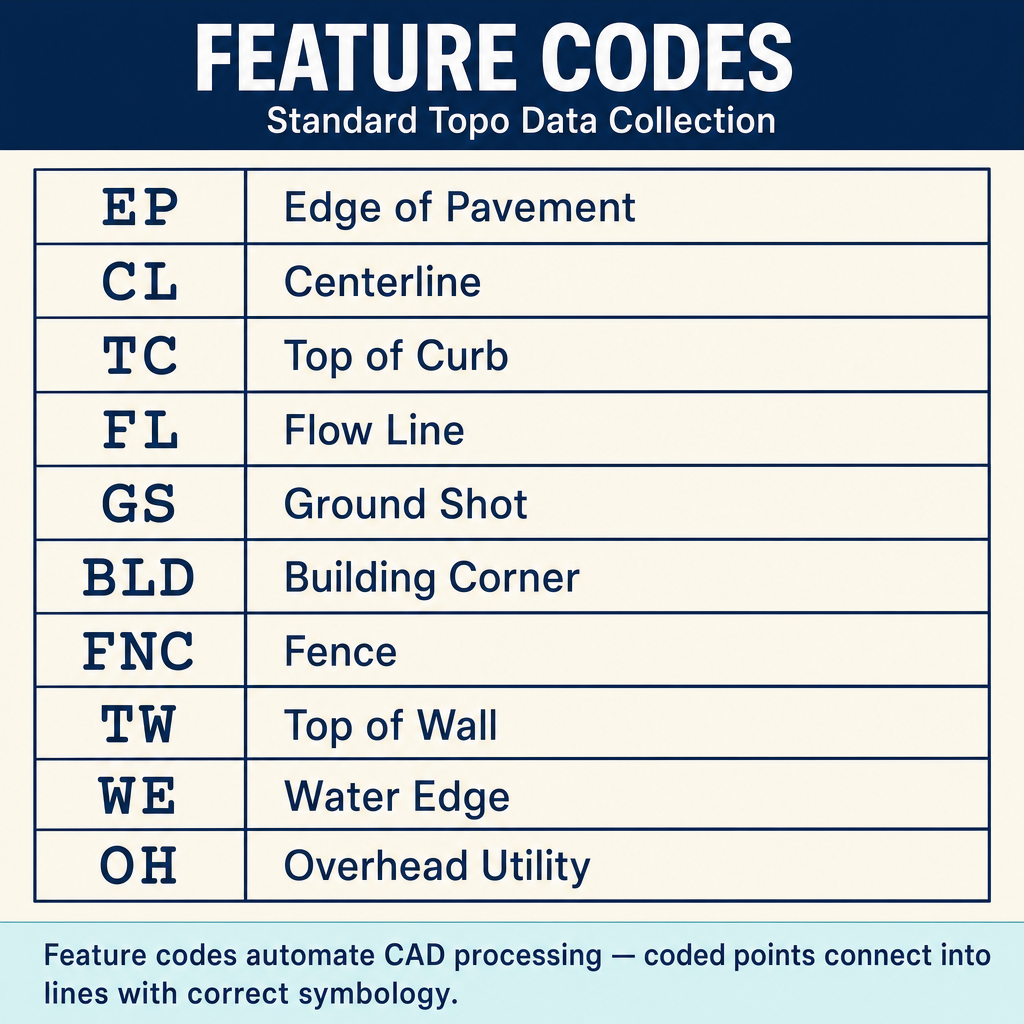
Field crews use a feature coding system to identify the type of each point collected. Common feature codes:
| Code | Feature |
|---|---|
| EP | Edge of pavement |
| CL | Centerline |
| TC / BC | Top of curb / Bottom of curb |
| FL | Flow line (invert) |
| GS | Ground shot |
| BLD | Building corner |
| FNC | Fence |
| TW / BW | Top of wall / Bottom of wall |
| WE | Water edge |
| OH | Overhead (utility lines) |
Feature codes allow automated processing in CAD software, connecting coded points into lines and assigning appropriate symbology.
Exam Tips
- Contour lines never cross -- this is the most fundamental property
- Closely spaced contours indicate steep terrain; widely spaced contours indicate flat terrain
- Contour lines form a V pointing upstream in valleys and a U pointing downhill on ridges
- Breaklines are essential for accurate terrain modeling at abrupt slope changes
- The contour interval must be appropriate for the terrain -- too large misses detail, too small creates clutter
- Feature codes streamline data processing and reduce errors
- GNSS RTK is efficient for open-area topographic surveys but limited under tree canopy
- The FS exam may ask you to interpret contour patterns or identify terrain features from a contour map
- Index contours are every fifth contour line and are labeled with elevation
Related Test Topics
- Digital Terrain Models (Module 2, Topic 2.6)
- Remote Sensing, LiDAR, and UAS (Module 2, Topic 2.8)
- Construction Surveys and Staking (Topic 1.8)
- Field Documentation (Topic 1.10)
Further Reading
Authoritative sources for deeper study
Wolf & Ghilani, Elementary Surveying — An Introduction to Geomatics (13th Ed., 2012) — Comprehensive surveying text covering instruments, field procedures, and computations.
Kavanagh, Surveying with Construction Applications (7th Ed.) — Combined surveying and construction-layout reference.
FGDC Geospatial Positioning Accuracy Standards — National standard for positional accuracy reporting (NSSDA).
Penn State GEOG 482 — The Nature of Geographic Information — Open courseware on map projections, datums, and geospatial data fundamentals.
Last updated: 2026-04-17